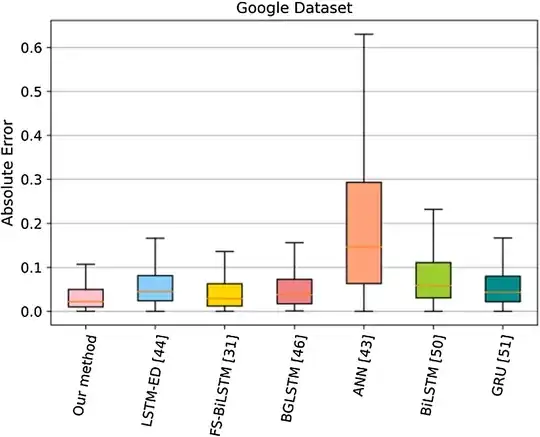
Recently I crossed this paper which represents the evaluation of various models' performances within a single dataset by Boxplot over $Absolute~Error~(AE)$ as follows:
 |
|---|
| Fig. 12: Boxplot of baseline methods for our method and previous studies for M1. ref |
Normally we use $Mean~Absolute~Error~(MAE)$ or $Mean~Square~Error~(MSE)$, etc for different models comparison.
I have checked this post: Box Plot Explained with Examples but still there some considerations like:
- Central Tendency Measures of Central Tendency & Median: Definition and Uses
- Variability Measures of Variability
- Skewness: Skewed Distributions
My question:
- How this representation can be interpreted? (knowing that the lower the error, the better model)
- Does it mean that instead of using $mean$ or $average$ of error calculation e.g. $Mean~Absolute~Error~(MAE)$ by bar plot, one can just collect all error estimations during learning and plot box plot? then which extra information can translate that classical bar plot over MAE could not?
I can not figure it out what is the benefits and logic behind it.
potentially related posts:
- Absolute Error as a tool to evaluate model
- Is it cheating to drop the outliers based on the boxplot of Mean Absolute Error to improve a regression model
- Can model variance be concluded using boxplot of error estimates?
- 'Absolute' benchmarks of model performance on dataset
- Mean absolute error vs sum absolute error
- Minimum "recommended" sample size for boxplots? Boxplots for different sample sizes
- How should we do boxplots with small samples?