The logistic regression does not fit classes but instead probabilities. The log loss for a single data point is
$$L = \begin{cases}
\log(\hat{p}_i)& \qquad \text{if $y=1$} \\
\log(1-\hat{p}_i) &\qquad \text{if $y=0$} \\
\end{cases}$$
where $\hat{p}$ is the fitted estimate.
If you change this with some parameter like
$$L = \begin{cases}
w_i\log(\hat{p}_i)& \qquad \text{if $y=1$} \\
\log(1-\hat{p}_i) &\qquad \text{if $y=0$} \\
\end{cases}$$
then this is similar to adding different weights to the cases with $y=1$.
Changing the loss function for fitting like this, is probably not gonna improve your results. The loss function used for the fitting needs to reflect the statistical model in order to make an estimate with a small error (to be efficient). You can use a second additional loss function in validation of the model and tweak the model based on the outcome of that second validation. The loss function in fitting is used to reduce error from statistical variations, the loss function in validation is used to reduce error/costs from model bias. (See also: Could a mismatch between loss functions used for fitting vs. tuning parameter selection be justified?)
For a logistic regression you can use a validation data set that you use to define a classification boundary and classification rules like
$$\text{'class 1 if $\hat{p}> p_c$'}\\
\text{'class 0 if $\hat{p} \leq p_c$'}$$
and optimize $p_c$ based on false positive and false negative rates in the validation data.
You can also possibly do this without a validation data set and compute false positive and false negative error rates based on the data used for fitting.
This procedure can look like the graph below occuring in this question: Are non-crossing ROC curves sufficient to rank classifiers by expected loss?
The graph shows an ROC curve, and superposed are isolines for the values of a cost function as function of the false and true positive rates.
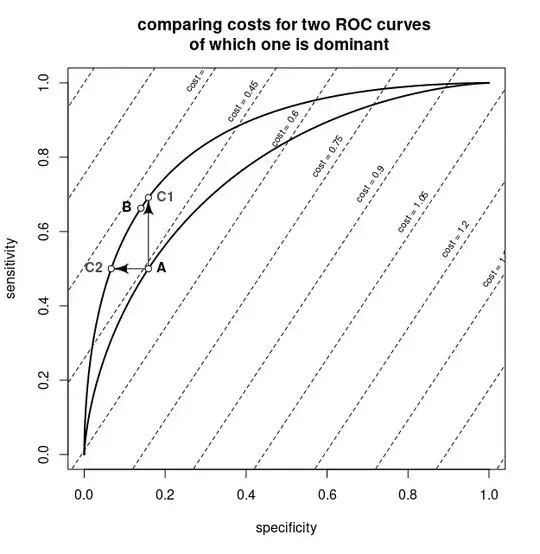
An example how such ROC curve stems from logistic regression is explained in Probability threshold in ROC curve analyses. The curve is like a parametric curve that is a function of $p_c$ and will look as something like the figure below.

If the model is not correctly specified (and the statistical fit based on likelihood will not function well) then it might be an interesting idea to fit a model by searching for a linear function as a classification boundary that only predicts the classification and not a value $p$. That is, optimize a linear function $X\beta$ such that we minimize
$$Cost =\begin{cases}
a & \quad \text{false positive $X\beta >0$ and $y=0$} \\
0 & \quad \text{true negative $X\beta <0$ and $y=0$} \\
0 & \quad \text{true positive $X\beta >0$ and $y=1$} \\
b &\quad\text{false negative $X\beta <0$ and $y=1$} \\ \end{cases}$$

