I just want to know if its possible to cluster an univariate time series, in order , say, to detect anomalies?
and do you have any online version for denstream code, in Matlab?
here is the time series
+0003;+0004;+0004;+0005;+0004;+0004;+0004;+0003;+0003;+0004;+0003;+0002;+0004;+0002;+0002;+0002;+0002;+0002;+0002;+0005;+0004;+0004;+0004;+0004;+0004;+0004;+0004;+0004;+0004;+0004;+0004;+0005;+0004;+0004;+0004;+0004;+0003;+0003;+0000;+0002;+0004;+0002;+0004;+0004;+0004;+0004;+0003;+0003;+0004;+0003;+0002;+0000;+0003;+0002;+0003;+0002;+0002;+0002;+0002;+0002;+0003;+0002;+0002;+0003;+0000;+0003;+0003;+0002;+0003;+0002;+0003;+0002;+0004;+0004;+0004;+0003;+0004;+0004;+0004;+0004;+0004;+0005;+0004;+0002;+0003;+0002;+0005;+0004;+0003;+0003;+0001;+0005;+0003;+0003;+0005;+0005;+0004;+0005;+0002;+0005;+0005;+0006;+0005;+0005;+0004;+0003;+0003;+0005;+0002;+0002;+0001;+0003;+0004;+0002;+0002;+0002;+0001;+0001;+0003;+0004;+0004;+0004;+0005;+0004;+0005;+0002;+0002;+0005;+0003;+0002;+0003;+0002;+0001;+0002;+0003;+0005;+0004;+0005;+0004;+0004;+0003;+0003;+0004;+0005;+0003;+0004;+0005;+0004;+0005;+0003;+0003;+0005;+0005;+0005;+0003;+0002;+0004;+0004;+0004;+0005;+0005;+0004;+0005;+0005;+0004;+0004;+0003;+0003;+0005;+0005;+0005;+0005;+0004
First you should now @IrishStat, that i should use a datamining technique for clustering,
an exemple of times serie dataset is presented in this : 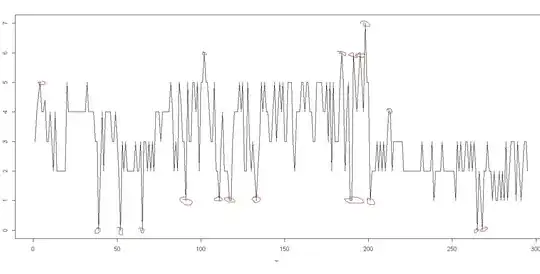
What i'm using now , is a density base clustering, let's said that I have adapte the Dbscan for streaming Time series points, and its Should detect anomalies, and changes eacht time,
after your introdudction , i'll trying to explain to u by pictures what i'm doing,
thanks u ,
time data series sample :
     [,1]
V1    3.0
V2    4.0
V3    4.5
V4    5.0
V5    4.0
V6    4.0
V7    4.4
V8    3.0
V9    3.0
V10   4.0
V11   3.0
V12   2.0
V13   4.0
V14   2.0
V15   2.0
V16   2.0
V17   2.0
V18   2.0
V19   2.0
..... so on
 where the anomalies are not visually obvious. A histogram of the original series
  and the histogram of the anomalie-cleansed series is informative.
 . In order to detect the statistically significant anomalies
  it was necessary to have a model
 (Note: There is no need for a logarithmic transformation as the variance of these errors is homogenous ) which yielded the following ACF for the error term
  . In many cases there are level shifts ( distinctly different means ) waiting to be discovered. For example the Nile Series (annual data for 100 years) is a series that illustrates this
  and
and  . The histogram of the original series is
  naively suggests just two pulses (low values) while a model containing the empirically identified level (mean) shift generates the following analysis
 with model
  detailing the step (level ) shift and the one-time pulses . Bacon summarized this, writing in Novum Organum about 400 years ago said:
"Errors of Nature, Sports and Monsters correct the
understanding in regard to ordinary things, and
reveal general forms. For whoever knows the ways
of Nature will more easily notice her deviations; and,
on the other hand, whoever knows her deviations
will more accurately describe her ways." which I have paraphrased
detailing the step (level ) shift and the one-time pulses . Bacon summarized this, writing in Novum Organum about 400 years ago said:
"Errors of Nature, Sports and Monsters correct the
understanding in regard to ordinary things, and
reveal general forms. For whoever knows the ways
of Nature will more easily notice her deviations; and,
on the other hand, whoever knows her deviations
will more accurately describe her ways." which I have paraphrased  . In summary detecting anomalies require a model which describes "typical behavior". Segmenting data into "typical and "atypical" is what Intervention Detection is all about
 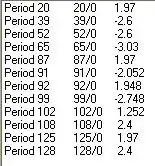 . The actual step-by-step analysis started with the ACF of the original series
  which led to an automatically identified ARIMA model
  which upon estimation was reduced to
  . Using procedures called Intervention Detection detailed by Tsay and others
 . Now the final ACF of the errors suggesting sufficiency is
  . The histogram of the original 173 values is of little help in detailing the anomalies and the level/step shift DUE to the auto-correlative structure in the 173 values.
  .The Histogram of the final model residuals ( original series adjusted for memory, 1 level shift and the one-time pulses ) is shown
 . The plot of actual and cleansed provides another view
  . Summary: to find the exception , one needs to have an expectation.