Demographics of the Northern Mariana Islands
Population
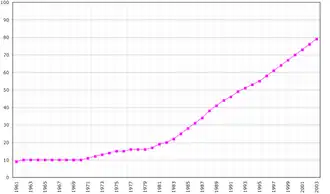
Demographics of the Northern Mariana Islands, Data of FAO, year 2005; Number of inhabitants in thousands.
Structure of the population
Population Estimates by Sex and Age Group (01.VII.2011): [1]
| Age Group | Male | Female | Total | % |
|---|---|---|---|---|
| Total | 22 153 | 23 897 | 46 050 | 100 |
| 0–4 | 2 495 | 2 357 | 4 852 | 10.54 |
| 5–9 | 1 883 | 1 739 | 3 622 | 7.87 |
| 10–14 | 1 971 | 1 529 | 3 500 | 7.60 |
| 15–19 | 2 121 | 1 681 | 3 802 | 8.26 |
| 20–24 | 1 607 | 1 791 | 3 398 | 7.38 |
| 25–29 | 1 050 | 2 781 | 3 831 | 8.32 |
| 30–34 | 1 008 | 2 688 | 3 696 | 8.03 |
| 35–39 | 1 550 | 1 661 | 3 211 | 6.97 |
| 40–44 | 1 858 | 1 726 | 3 584 | 7.78 |
| 45–49 | 1 967 | 1 771 | 3 738 | 8.12 |
| 50–54 | 1 824 | 1 617 | 3 441 | 7.47 |
| 55–59 | 1 260 | 1 010 | 2 270 | 4.93 |
| 60–64 | 769 | 671 | 1 440 | 3.13 |
| 65-69 | 366 | 428 | 794 | 1.72 |
| 70-74 | 248 | 168 | 416 | 0.90 |
| 75-79 | 101 | 138 | 239 | 0.52 |
| 80-84 | 54 | 93 | 147 | 0.32 |
| 85-89 | 17 | 36 | 53 | 0.12 |
| 90-94 | 3 | 11 | 14 | 0.03 |
| 95-99 | 1 | 0 | 1 | <0.01 |
| 100+ | 0 | 1 | 1 | <0.01 |
| Age group | Male | Female | Total | Percent |
| 0–14 | 6 349 | 5 625 | 11 974 | 26.00 |
| 15–64 | 15 014 | 17 397 | 32 411 | 70.38 |
| 65+ | 790 | 875 | 1 665 | 3.62 |

David Apatang stands with Airmen visiting the Northern Marianas
Demographic features of the population of the Northern Mariana Islands include population density, ethnicity, education level, health of the populace, economic status, religious affiliations and other aspects.
Births and deaths
Population from census data, other data from CDC Births/Deaths reports. [2]
| Year | Population | Live births | Deaths | Natural increase | Crude birth rate (per 1000) | Crude death rate (per 1000) | Natural Change (per 1000) | Total Fertility Rate |
|---|---|---|---|---|---|---|---|---|
| 1998 | 1,462 | 162 | 1,300 | 21.9 | 2.4 | 19.5 | 1.79 | |
| 1999 | 1,381 | 162 | 1,219 | 20.0 | 2.3 | 17.7 | 1.68 | |
| 2000 | 69,221 | 1,431 | 136 | 1,295 | 19.9 | 1.9 | 18.0 | 1.68 |
| 2001 | 1,449 | 148 | 1,301 | 19.4 | 2.1 | 17.3 | 1.65 | |
| 2002 | 1,290 | 161 | 1,129 | 17.4 | 2.2 | 15.2 | 1.27 | |
| 2003 | 1,349 | 142 | 1,207 | 17.7 | 1.9 | 15.8 | 1.29 | |
| 2004 | 1,355 | 164 | 1,191 | 17.3 | 2.1 | 15.2 | 1.23 | |
| 2005 | 1,335 | 186 | 1,149 | 16.6 | 2.3 | 14.3 | 1.16 | |
| 2006 | 1,422 | 170 | 1,252 | 17.2 | 2.1 | 15.1 | 1.21 | |
| 2007 | 1,387 | 137 | 1,250 | 16.4 | 1.6 | 14.8 | 1.13 | |
| 2008 | 1,265 | 178 | 1,087 | 22.9 | 3.2 | 19.7 | 2.30 | |
| 2009 | 1,109 | 203 | 906 | 21.5 | 3.9 | 17.6 | 2.27 | |
| 2010 | 53,883 | 1,072 | 174 | 898 | 20.0 | 3.3 | 16.7 | 2.19 |
| 2011 | 1,033 | 165 | 868 | 19.8 | 3.2 | 16.6 | 2.17 | |
| 2012 | 853 | 163 | 690 | 16.6 | 3.2 | 13.4 | 1.83 | |
| 2013 | 686 | 185 | 501 | 13.4 | 3.6 | 9.8 | 1.58 | |
| 2014 | 517 | 202 | 315 | 10.0 | 3.9 | 6.1 | 1.58 | |
| 2015 | 416 | 223 | 193 | 8.2 | 4.3 | 3.9 | 1.08 | |
| 2016 | 427 | 220 | 207 | 7.9 | 4.2 | 3.7 | 1.50 | |
| 2017 | 363 | 232 | 131 | 6.9 | 4.4 | 2.5 | 1.33 | |
| 2018 | 566 | 221 | 345 | 10.9 | 4.3 | 6.6 | 2.10 | |
| 2019 | 686 | 209 | 477 | 13.3 | 4.0 | 9.3 | 2.64 | |
| 2020 | 47,329 | 628 | 219 | 409 | 12.1 | 4.2 | 7.9 | 2.41 |
| 2021 | 570 | 11.0 | 2.20 | |||||
| 2022 | 467 | 9.1 | 1.73 | |||||
| 2023 | 579 | 11.3 | 2.13 | |||||
|}
Ethnic groups
- Asian 50% (includes Filipino 35.3%, Chinese 6.8%, Korean 4.2%, and other Asian 3.7%)
- Native Hawaiian or other Pacific Islander 34.9% (includes Chamorro 23.9%, Carolinian people 4.6%, and other Native Hawaiian or Pacific Islander 6.4%),
- Other 2.5%, two or more ethnicities or races 12.7% (2010 est.)
Languages
- Philippine languages 32.8%
- Chamorro (official) 24.1%
- English (official) 17%
- Other Pacific island languages (Refaluwasch, official) 10.1%
- Chinese 6.8%
- Other Asian languages 7.3%
- Other 1.9%
Religion
According to the Pew Research Center, 2010:[3]
- Roman Catholic 64.1%
- Protestants 16%
- Buddhists 10.6%
- Folk religions 5.3%
- Other Christians 1.2%
- Other religions 1.1%
- Unaffiliated 1.0%
- Muslim 0.7%[4]
- Eastern Orthodox <1%
- Hindu <1%
- Jews <1%
See also
- Northern Mariana citizenship and nationality
References
- ↑ "UNSD — Demographic and Social Statistics". unstats.un.org. Retrieved 2023-05-10.
- ↑ "National Vital Statistics Reports". 9 March 2024.
- ↑ "Northern Mariana Islands". Archived from the original on 2019-04-21. Retrieved 2017-09-12.
- ↑ "AGAMA DI KEPULAUAN MARIANA UTARA". www.religion-facts.com.
- CIA World Factbook
This article is issued from Wikipedia. The text is licensed under Creative Commons - Attribution - Sharealike. Additional terms may apply for the media files.