Demographics of Glasgow
| Demographics of Glasgow | |
|---|---|
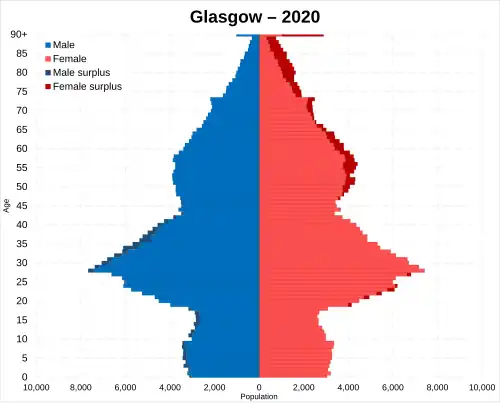 Population pyramid of Glasgow | |
| Population | 593,245 (2011) |
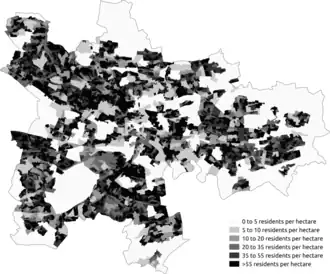
| Density | 3,390/km2 (8,780/sq mi). |
Glasgow is the most populous city in Scotland and the fourth most populous city in the United Kingdom.
Population
Glasgow's total population, according to the 2011 UK census, was 593,245. The population density was 3,390/km2 (8,780/sq mi).
Ethnicity
The following table shows the ethnic group of respondents in the previous four censuses in Glasgow alongside two estimates.
A Home Office report officially estimated that the 'coloured' population of Glasgow in 1958 was likely around 3,000 to 5,000, the majority being Asian (2,000 Pakistanis and 2,000 Indians).[1]
| Ethnic Group | 1971 estimations | 1981 estimations[2] | 1991 census[3][4] | 2001 census[5] | 2011 census[6] | 2022 census[7] | ||||||
|---|---|---|---|---|---|---|---|---|---|---|---|---|
| Number | % | Number | % | Number | % | Number | % | Number | % | Number | % | |
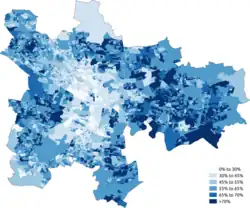
| White: Total | – | – | 729,092 | 97.9% | 641,336 | 96.75% | 546,359 | 94.55% | 524,561 | 88.42% | 501,029 | 80.71% |
| White: Scottish | – | – | – | – | – | – | 503,614 | 87.15% | 466,241 | 78.59% | 416,634 | 67.12% |
| White: Other British | – | – | – | – | – | – | 20,934 | 3.62% | 24,154 | 4.07% | 35,011 | 5.64% |
| White: Irish | – | – | – | – | 10,384 | 1.56% | 11,467 | 1.98% | 11,228 | 1.89% | 11,130 | 1.79% |
| White: Gypsy/Traveller[a] | – | – | – | – | – | – | – | – | 407 | 0.07% | 201 | 0.03% |
| White: Polish[a] | – | – | – | – | – | – | – | – | 8,406 | 1.42% | 12,183 | 1.96% |
| White: Other | – | – | – | – | – | – | 10,344 | 1.79% | 14,125 | 2.38% | 25,870 | 4.17% |
| Asian, Asian Scottish or Asian British: Total | 12,000[8] | 1.3% | – | – | 18,242 | 2.75% | 25,636 | 4.44% | 47,758 | 8.05% | 68,793 | 11.08% |
| Asian, Asian Scottish or Asian British: Indian | – | – | – | – | 3,374 | 0.5% | 4,173 | 0.72% | 8,640 | 1.46% | 13,990 | 2.25% |
| Asian, Asian Scottish or Asian British: Pakistani | – | – | – | – | 10,945 | 1.65% | 15,330 | 2.65% | 22,405 | 3.78% | 30,912 | 4.98% |
| Asian, Asian Scottish or Asian British: Bangladeshi | – | – | – | – | 191 | – | 237 | 0.04% | 458 | 0.08% | 954 | 0.15% |
| Asian, Asian Scottish or Asian British: Chinese | – | – | – | – | 2,780 | 0.41% | 3,876 | 0.67% | 10,689 | 1.80% | 14,300 | 2.30% |
| Asian, Asian Scottish or Asian British: Asian Other | – | – | – | – | 952 | 0.14% | 2,020 | 0.35% | 5,566 | 0.94% | 8,640 | 1.39% |
| Black, Black Scottish or Black British[a] | – | – | – | – | – | – | 1,792 | 0.31% | – | – | – | – |
| African: Total | – | – | – | – | 489 | – | – | – | 12,440 | 2.10% | 22,272 | 3.59% |
| African: African, African Scottish or African British | – | – | – | – | 489 | – | – | – | 12,298 | 2.07% | 2,798 | 0.45% |
| African: Other African | – | – | – | – | – | – | – | – | 142 | 0.02% | 19,474 | 3.14% |
| Caribbean or Black: Total | – | – | – | – | 709 | – | – | – | 1,806 | 0.30% | 1,471 | 0.24% |
| Caribbean | – | – | – | – | 220 | – | – | 783 | 0.13% | 335 | 0.05% | |
| Black | – | – | – | – | – | – | – | – | 820 | 0.14% | 96 | 0.02% |
| Caribbean or Black: Other | – | – | – | – | 489 | – | – | 203 | 0.03% | 1,033 | 0.17% | |
| Mixed or multiple ethnic groups: Total | – | – | – | – | – | – | 2,046 | 0.35% | 2,879 | 0.49% | 10,624 | 1.71% |
| Other: Total | – | – | – | – | 1,840 | 0.27% | 2,036 | 0.35% | 3,801 | 0.64% | 16,571 | 2.67% |
| Other: Arab[a] | – | – | – | – | – | – | – | – | 2,631 | 0.44% | 8,671 | 1.40% |
| Other: Any other ethnic group | – | – | – | – | 1,840 | 0.27% | 2,036 | 0.35% | 1,170 | 0.20% | 7,903 | 1.27% |
| Non-White: Total | – | – | 15,286 | 2.1% | 21,517 | 3.25% | 31,510 | 5.45% | 68,684 | 11.58% | 119,726 | 19.29% |
| Total: | – | – | 744,378 | 100% | 662,853 | 100% | 577,869 | 100% | 593,245 | 100% | 620,756 | 100% |
 White
White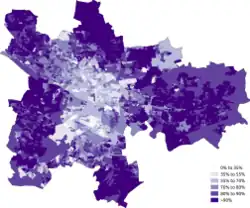 White-Scottish
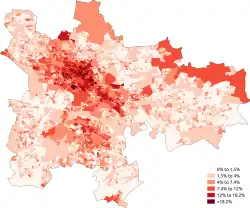 White-Other British
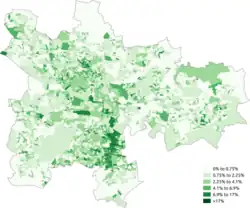 White-Irish
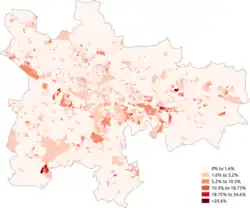 White-Polish
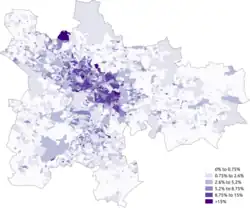 White-Other
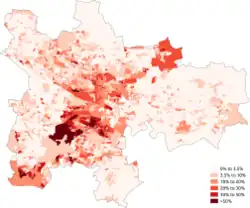 Asian
Asian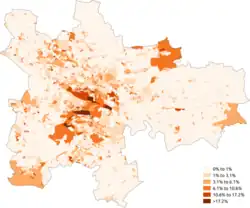 Asian-Indian
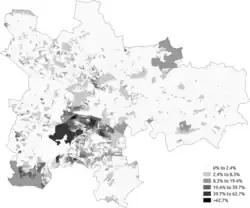 Asian-Pakistani
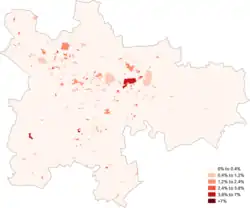 Asian-Bangladeshi
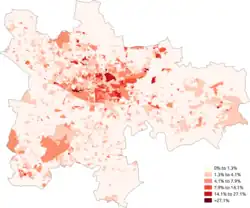 Asian-Chinese
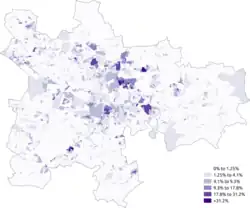 African
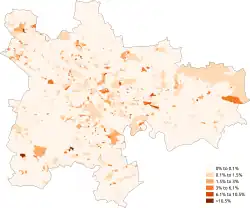 Caribbean or Black
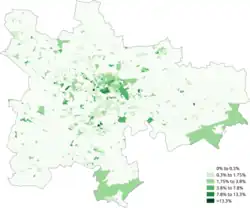 Other-Arab
Country of Birth
The proportion of people residing in Glasgow born outside the UK was 19.1% in 2022, compared with 12.2% in 2011 and 5.7% in 2001. Below are the fifteen largest overseas-born groups in Glasgow according to the 2022 census, alongside the two previous censuses.[9]
| Country of birth | 2022 | 2011 | 2001 |
|---|---|---|---|
| 12,508 | 9,319 | 5,995 | |
| 10,601 | 7,577 | 281 | |
| 10,212 | 5,789 | 2,364 | |
| 7,857 | 5,513 | 730 | |
| 5,448 | 2,761 | 199 | |
| 3,964 | 1,866 | 1,122 | |
| 3,643 | 4,339 | 5,113 | |
| 3,189 | 1,028 | 674 | |
| 2,647 | 1,136 | 592 | |
| 2,290 | 722 | 367 | |
| 2,262 | 1,948 | 1,379 | |
| 2,095 | 1,430 | 1,406 | |
| 2,029 | 1,191 | 750 | |
| 1,830 | 460 | 43 | |
| 1,688 | 1,077 | 701 | |
| Overall – all overseas-born | 118,819 | 72,607 | 32,690 |
The country of birth of Glasgow for 1981 is as follows;
| Country of Birth | Year | |
|---|---|---|
| 1981[10] | ||
| Number | % | |
| 728,050 | 96.4% | |
| 19,592 | 2.6% | |
| 701,054 | 92.8% | |
| 921 | ||
| – | – | |
| 6,483 | 0.9% | |
| Europe (non-UK) | 12,778 | 1.7% |
| 9,341 | ||
| Other EEC | 2,334 | |
| Other Europe | 1,103 | |
| Asia and Middle East | 8,286 | 1.1% |
| 2,624 | ||
| 3,532 | ||
| 152 | ||
| Far East | 1,978 | |
| Middle East | – | – |
| Africa | 1,227 | 0.2% |
| North America | – | – |
| South America | – | – |
| Oceania | – | – |
| Other: New Commonwealth[n 1] | 356 | |
| Other: Old Commonwealth[n 2] | 1,479 | 0.2% |
| Other: | 3,012 | 0.4% |
| Total | 755,377 | 100% |
- ↑ Used as main option for when no other options are given, for example in 1971. This group contains all for Canada, Australia and New Zealand
- ↑ Used as a conglomerate for New Commonwealth for when there are no other options as for example in 1971. This group contains all for remenents of the British Empire after 1945 (if not already indicated).
Languages
The languages other than English used at home in Glasgow according to the 2011 census are shown below.[11]
| Language | Usual residents aged 3+ | Proportion |
|---|---|---|
| English only | 496,027 | 86.62% |
| Gaelic | 2,305 | 0.40% |
| Scots | 2,826 | 0.49% |
| British Sign Language | 1,717 | 0.30% |
| Polish | 7,379 | 1.29% |
| Other | 62,379 | 10.89% |
Religion
The following table shows the religion of respondents in the 2001, 2011 and 2022 censuses in Glasgow.
| Current religion | 2001[5] | 2011[12] | 2022[13] | |||
|---|---|---|---|---|---|---|
| Number | % | Number | % | Number | % | |
| Christianity | 374,393 | 64.79% | 322,954 | 54.44% | 240,337 | 38.72% |
| –Roman Catholic | 168,733 | 29.20% | 161,685 | 27.25% | 128,743 | 20.74% |
| –Church of Scotland | 182,172 | 31.52% | 136,889 | 23.07% | 82,585 | 13.30% |
| –Other Christian | 23,488 | 4.06% | 24,380 | 4.11% | 29,009 | 4.67% |
| Islam | 17,792 | 3.08% | 32,117 | 5.41% | 48,766 | 7.86% |
| Hinduism | 1,209 | 0.21% | 4,074 | 0.69% | 8,166 | 1.32% |
| Buddhism | 1,194 | 0.21% | 2,570 | 0.43% | 2,854 | 0.46% |
| Sikhism | 2,374 | 0.41% | 3,149 | 0.53% | 3,456 | 0.56% |
| Judaism | 1,083 | 0.19% | 897 | 0.15% | 973 | 0.16% |
| Paganism[b] | — | — | — | — | 2,001 | 0.32% |
| Other religion | 3,799 | 0.66% | 1,599 | 0.27% | 1,817 | 0.29% |
| No religion | 131,189 | 22.70% | 183,835 | 30.99% | 268,327 | 43.23% |
| Religion not stated | 44,836 | 7.76% | 42,050 | 7.09% | 44,076 | 7.10% |
| No religion/Not stated total | 176,025 | 30.46% | 225,885 | 38.08% | 312,403 | 50.33% |
| Total population | 577,869 | 100.00% | 593,245 | 100.00% | 620,756 | 100.00% |
 Christianity
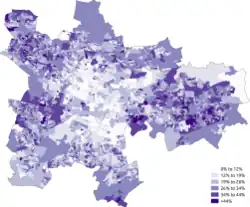 Church of Scotland
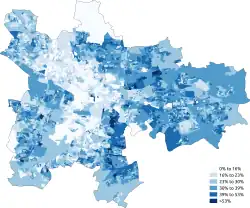 Roman Catholic
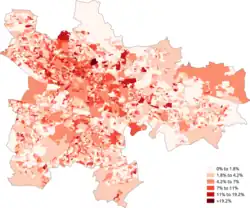 Other Christian
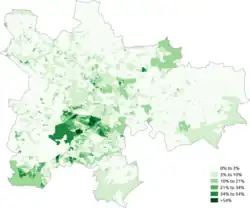 Islam
Islam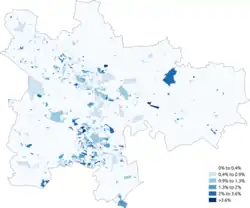 Judaism
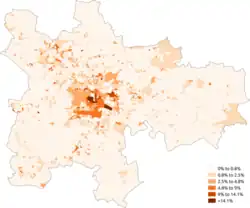 Hinduism
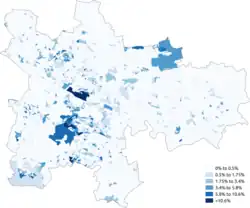 Sikhism
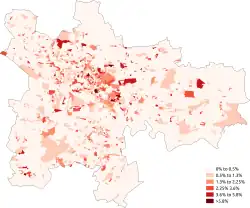 Buddhism
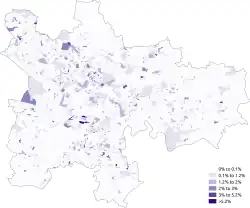 Other religion
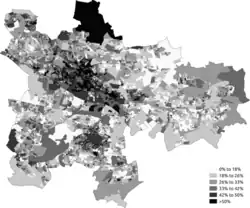 No religion
National identity
The 2022 census found that of the 620,756 people residing in Glasgow, 62.3% identified with the Scottish identity only, 11.8% identified with the British identity only and 7.1% identified with both identities. 2.5% identified with other UK identities (including English identity), 12.9% identified with an other identity only and the remaining 0.5% identified with at least one UK identity and an other identity.[14]
See also
- Demographics of the United Kingdom
- Demographics of Scotland
- Demographics of Edinburgh
- Demographics of London
- Demographics of Birmingham
- Demographics of Greater Manchester
- List of towns and cities in Scotland by population
- Subdivisions of Scotland
- Wards of Glasgow
Notes
References
- ↑ J. A.G. Griffith, Judith Henderson (1960). Coloured Immigrants in Britain. Internet Archive. Oxford University Press. p. 15.
- ↑ Equality, Commission for Racial (1985). "Ethnic minorities in Britain: statistical information on the pattern of settlement". Commission for Racial Equality: Table 2.2.
- ↑ As UK Census data post 2001 is unavailable through the ONS website, it has been recommended to use archival census collection websites to obtain data. Data is taken from United Kingdom Casweb Data services of the United Kingdom 1991 Census on Ethnic Data for Scotland. Archived 2022-04-05 at the Wayback Machine (Table 6)
- ↑ Office of Population Censuses and Surveys; General Register Office for Scotland; Registrar General for Northern Ireland (1997): 1991 Census aggregate data. UK Data Service (Edition: 1997). DOI: http://dx.doi.org/10.5257/census/aggregate-1991-1 This information is licensed under the terms of the Open Government Licence
- 1 2 "Briefing Paper 2011 Census – Release 2A – Results for Glasgow City". Glasgow City Council. 17 October 2013. Archived from the original on 24 September 2015. Retrieved 22 January 2014.
- ↑ "Scotland's Census 2011 – Table KS201SC". scotlandscensus.gov.uk. Retrieved 3 November 2015.
- ↑ "Home". Scotland's Census. Retrieved 2024-05-21.
- ↑ McEvoy, David (1978-12-01). "The segregation of Asian immigrants in Glasgow: A note". Scottish Geographical Magazine. 94 (3): 180–182. doi:10.1080/00369227808736406. ISSN 0036-9225.
- ↑ "Table UV204 - Country of birth: Country by Country of Birth by Individuals". National Records of Scotland. Retrieved 24 May 2024. > 'Glasgow City' > 'Ethnic group, national identity, language and religion' > 'Country of birth: UV204'
- ↑ Taken from Casweb UK Data Service from the 1981 UK wide Census. Table 4 of Country of Birth in Scotland.
- ↑ "Scotland's Census 2011 – Table DC2119SC". scotlandscensus.gov.uk. Retrieved 3 November 2015.
- ↑ "Scotland's Census 2011 – Table KS209SCb". scotlandscensus.gov.uk. Retrieved 3 November 2015.
- ↑ "Scotland's Census 2022 - Ethnic group, national identity, language and religion - Chart data". Scotland's Census. National Records of Scotland. 21 May 2024. Retrieved 21 May 2024. Alternative URL 'Search data by location' > 'Local Authority (CA2019)' > 'Glasgow City' > 'Ethnic group, national identity, language and religion' > 'Religion'
- ↑ "Scotland's Census 2022 - UV202 - National identity". UK Data Service. Retrieved 6 June 2024.
Glasgow City | ||
|---|---|---|
| History |
|  |
| Politics |
| |
| Geography |
| |
| Culture |
| |
| Transport |
| |
| Education |
| |
| Religion |
| |
| Sport |
| |
| Attractions |
| |
| Health |
| |
| Economy |
| |
| ||