Demographics of Asia
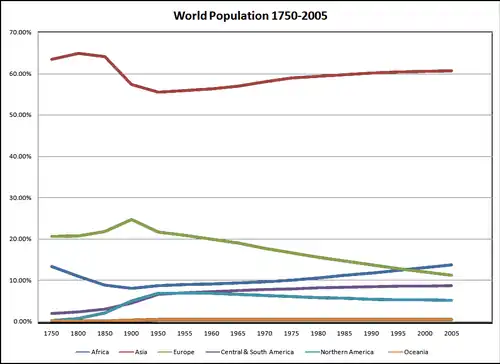
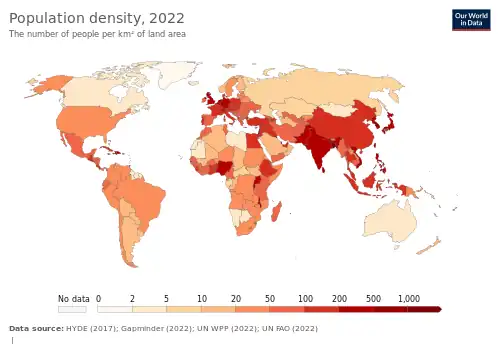
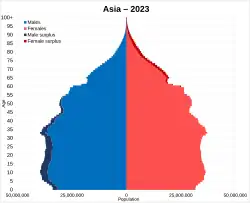
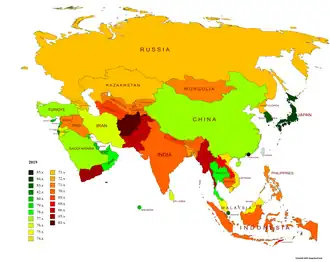
The continent of Asia covers 29.4% of the Earth's land area and has a population of around 4.75 billion (as of 2022),[1] accounting for about 60% of the world population. The combined population of both China and India is estimated to be over 2.8 billion people as of 2022. Asia's population is projected to grow to 5.25 billion by 2055, or about 54% of projected world population at that time.[1] Population growth in Asia was close to 0.55% p.a. as of 2022, with highly disparate rates. Many Western Asian and South Asian countries have growth rates far above the world average, notably Pakistan at 2% p.a., and India with a 0.6% increase in 2022. On the other hand, East Asian nations are in the middle of a demographic stagnation, with China experiencing a small decrease of –0.06%, after years of rapidly slowing growth.
Population
History
Population of Asia, 1–1820 AD (in millions)
Source: Maddison et al.[2]
| Year[2] | 1 | 1000 | 1500 | 1600 | 1700 | 1820 |
|---|---|---|---|---|---|---|
| China | 59.6 | 59.0 | 103.0 | 160.0 | 138.0 | 381.0 |
| India | 75.0 | 75.0 | 110.0 | 135.0 | 165.0 | 209.0 |
| Japan | 3.0 | 7.5 | 15.4 | 18.5 | 27.0 | 31.0 |
| Korea | 1.6 | 3.9 | 8.0 | 10.0 | 12.2 | 13.8 |
| Indonesia | 2.8 | 5.2 | 10.7 | 11.7 | 13.1 | 17.9 |
| Indochina | 1.1 | 2.2 | 4.5 | 5.0 | 5.9 | 8.9 |
| Other East Asia | 5.9 | 9.8 | 14.4 | 16.9 | 19.8 | 23.6 |
| Iran | 4.0 | 4.5 | 4.0 | 5.0 | 5.0 | 6.6 |
| Turkey | 6.1 | 7.3 | 6.3 | 7.9 | 8.4 | 10.1 |
| Other West Asia | 15.1 | 8.5 | 7.5 | 8.5 | 7.4 | 8.5 |
| Total Asia | 174.2 | 182.9 | 283.8 | 378.5 | 401.8 | 710.4 |
Shares of world population, Asia, 1–1998 AD (percent of world total)
Source: Maddison et al.[2]
| Year[2] | 1 | 1000 | 1500 | 1600 | 1700 | 1820 | 1870 | 1913 | 1950 | 1973 | 1999 |
|---|---|---|---|---|---|---|---|---|---|---|---|
| China | 25.8 | 22.0 | 23.5 | 28.8 | 22.9 | 36.6 | 28.2 | 24.4 | 21.7 | 22.5 | 21.0 |
| India | 32.5 | 28.0 | 25.1 | 24.3 | 27.3 | 20.1 | 19.9 | 17.0 | 14.2 | 14.8 | 16.5 |
| Japan | 1.3 | 2.8 | 3.5 | 3.3 | 4.5 | 3.0 | 2.7 | 2.9 | 3.3 | 2.8 | 2.1 |
| Other Asia | 15.9 | 15.4 | 12.7 | 11.7 | 11.9 | 8.6 | 9.4 | 10.3 | 15.5 | 17.3 | 19.8 |
| Total Asia (excluding Japan) | 74.2 | 65.4 | 61.3 | 64.8 | 62.1 | 65.3 | 57.5 | 51.7 | 51.4 | 54.7 | 57.4 |
| World | 100.0 | 100.0 | 100.0 | 100.0 | 100.0 | 100.0 | 100.0 | 100.0 | 100.0 | 100.0 | 100.0 |
Countries ranking by international organisations
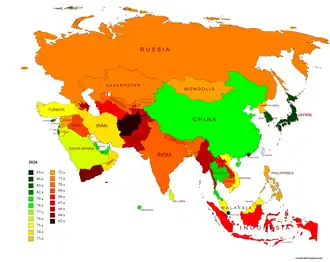
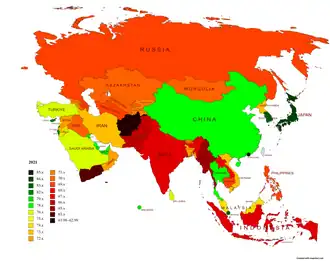
| Countries | Population (Thousands) | TFR | Population Growth Rate (percentage) | Life Expectancy at birth (years) | Median Age as of 1 July (years) | Net Migration Rate (per 1000 people) |
|---|---|---|---|---|---|---|
| 1,444,436.244 | 1.96 | 0.90 | 72.2 | 28.4 | -0.4 | |
| 1,420,909 | 1.01 | -0.22 | 78.0 | 39.6 | -0.2 | |
| 282,354 | 2.12 | 0.80 | 71.3 | 30.1 | -0.1 | |
| 249,336 | 3.55 | 1.54 | 67.8 | 20.4 | -5.6 | |
| 172,507 | 2.14 | 1.22 | 74.9 | 25.7 | -2.7 | |
| 124,071 | 1.22 | -0.51 | 84.9 | 49.4 | 1.2 | |
| 115,371 | 1.89 | 0.82 | 69.9 | 25.7 | -1.4 | |
| 100,675 | 1.90 | 0.62 | 74.7 | 32.9 | -0.6 | |
| 91,115 | 1.68 | 0.99 | 77.9 | 33.4 | 2.1 | |
| 87,372 | 1.62 | 0.23 | 77.4 | 33.0 | -3.2 | |
| 71,689 | 1.20 | -0.06 | 76.6 | 40.1 | 0.3 | |
| 54,320 | 2.10 | 0.66 | 67.1 | 29.8 | -0.7 | |
| 51,738 | 0.73 | -0.08 | 84.4 | 45.1 | 1.5 | |
| 45,558 | 3.22 | 2.10 | 72.4 | 20.6 | -0.4 | |
| 42,045 | 4.76 | 2.83 | 66.3 | 17.1 | -1.0 | |
| 33,661 | 2.31 | 1.78 | 79.0 | 29.6 | 3.6 | |
| 36,010 | 3.49 | 1.93 | 72.5 | 27.0 | -0.2 | |
| 35,344 | 1.54 | 1.20 | 76.8 | 30.5 | 4.9 | |
| 39,987 | 4.50 | 2.94 | 69.4 | 18.3 | -0.3 | |
| 29,674 | 1.96 | -0.15 | 70.6 | 25.0 | -13.5 | |
| 26,460 | 1.78 | 0.29 | 73.7 | 36.3 | -0.1 | |
| 23,038 | 1.95 | 0.56 | 77.7 | 33.1 | -1.2 | |
| 24,175 | 2.70 | 4.04 | 72.6 | 22.8 | 22.2 | |
| 20,464 | 2.98 | 1.25 | 74.5 | 29.6 | -0.4 | |
| 17,533 | 2.55 | 1.20 | 70.8 | 26.0 | -1.9 | |
| 11,531 | 2.60 | 0.38 | 78.0 | 24.5 | -13.5 | |
| 10,305 | 1.67 | 0.62 | 74.6 | 33.1 | 1.1 | |
| 10,492 | 3.04 | 1.87 | 71.9 | 22.1 | -2.0 | |
| 9,322 | 2.79 | 1.39 | 82.7 | 29.2 | 1.1 | |
| 10,839 | 1.21 | 3.41 | 83.1 | 31.6 | 25.3 | |
| 7,718 | 2.40 | 1.34 | 69.2 | 24.6 | -1.3 | |
| 7,433 | 0.73 | -0.49 | 85.6 | 46.8 | -2.6 | |
| 7,131 | 2.78 | 1.54 | 71.8 | 25.3 | 0.5 | |
| 7,431 | 2.66 | 1.70 | 70.2 | 26.6 | 2.0 | |
| 5,812 | 0.95 | 0.68 | 83.9 | 35.7 | 3.4 | |
| 5,786 | 2.23 | 0.70 | 77.9 | 28.6 | -3.0 | |
| 5,165 | 2.51 | 4.41 | 80.2 | 29.5 | 29.2 | |
| 4,884 | 1.52 | 2.04 | 80.6 | 34.8 | 12.5 | |
| 3,808 | 1.80 | -0.01 | 74.7 | 37.0 | 0.5 | |
| 3,454 | 2.63 | 1.22 | 72.0 | 26.9 | 0.0 | |
| 2,984 | 1.72 | -0.71 | 75.8 | 36.1 | -10.1 | |
| 3,012 | 1.72 | 2.36 | 82.5 | 33.6 | 15.1 | |
| 1,588 | 1.81 | 2.40 | 81.4 | 33.2 | 14.1 | |
| 1,392 | 2.63 | 1.27 | 67.9 | 21.3 | -1.8 | |
| 1,352 | 1.38 | 0.95 | 81.8 | 38.2 | 6.0 | |
| 789 | 1.45 | 0.61 | 73.3 | 29.9 | -0.4 | |
| 719 | 0.68 | 0.39 | 83.2 | 38.9 | 2.2 | |
| 527 | 1.56 | 0.36 | 81.3 | 31.9 | -4.6 | |
| 461 | 1.73 | 0.80 | 75.5 | 32.2 | 0 | |
| Asia | 4,792,493 | 1.88 | 0.60 | 74.8 | 32.1 | -0.5 |
| Population Replacement | 2.1 | |||||
Economy
Economically, most of Asia is traditionally considered part of the Second World, with the significant exception of the industrialized First World countries of Israel, Japan, Taiwan and South Korea. Asian countries in the G-20 major economies include China, Japan, South Korea, India, Indonesia, Turkey and Saudi Arabia. Of these, Japan is also in the G8, and additionally China and India in the G8+5.
The Human Development Index of Asian countries range from Low to Very High category. The table below shows the 10 highest and lowest countries according to their Human Development Index scores based on the 2021 report.[4]
|
10 highest HDIs
|
10 lowest HDIs
| ||||||||||||||||||||||||||||||||||||||||||||||||||||||||||||||||||||||||||||||||||
Ethnicities
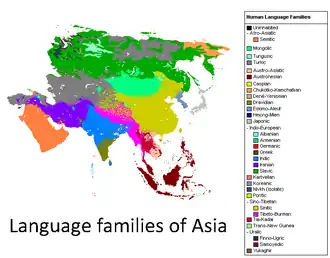
- Central Asian peoples: Turkic peoples, Iranian peoples
- East Asian peoples: List of Chinese ethnic groups (historical), Japanese people, Koreans, Mongols
- South Asian peoples: Ethnic groups of India, Ethnic groups in Pakistan, Dravidians, Indo-Aryans, Munda people
- Southeast Asian peoples: Austronesian peoples, Tai peoples; List of ethnic groups in Cambodia, ethnic groups in Indonesia, List of ethnic groups in Laos, Ethnic groups of the Philippines, List of ethnic groups in Vietnam
- West Asian peoples: Arab people, Jews, Samaritans, Druze, Peoples of the Caucasus (transcontinental), Ethnic minorities in Iran, Ethnic minorities in Iraq; Iranian peoples, Turkmen, Turks
See also
References
- 1 2 "Asia Population". World Population Prospects 2022. United Nations. Retrieved 23 January 2023.
- 1 2 3 4 Maddison (27 July 2016). "Growth of World Population, GDP and GDP Per Capita before 1820" (PDF).
- ↑ "World Population Prospects - Population Division - United Nations". population.un.org/.
- ↑ "Human Development Report 2020" (PDF). Human Development Report Office of the United Nations Development Programme. Retrieved 28 December 2020.
External links
| Sovereign states |
|
|---|---|
| States with limited recognition | |
| Dependencies and other territories |
|
| |