Questions tagged [pgfplotstable]

{pgfplotstable} is a package that can read, parse, modify or generate tables. Data is provided via either external files or inline code. It also serves as the data handler of the graphics package {pgfplots}.

The tag is suitable for questions related to the data handling or table typesetting via the package pgfplotstable. Though it is shipped as a by-product of pgfplots package, it offers a quite comprehensive table typesetting framework.

The main focus of this package, is to acquire data from various sources, to manipulate data, to allow for changing the table column/row properties and eliminate the manual (La)TeX-table typesetting.

Examples

Typesetting an inline table is done using the \pgfplotstabletypeset command, example from the manual:

\documentclass{article}

\usepackage{pgfplotstable}

\begin{document}
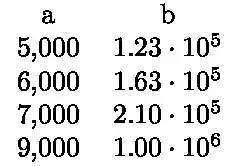
\pgfplotstabletypeset[sci zerofill]{
    a   b
    5000 1.234e5
    6000 1.631e5
    7000 2.1013e5
    9000 1000000
  }
\end{document}

enter image description here

The following examples are also adapted from the manual using an external datafile called pgfplotstable.dat:

# Convergence results
# fictional source, generated 2008
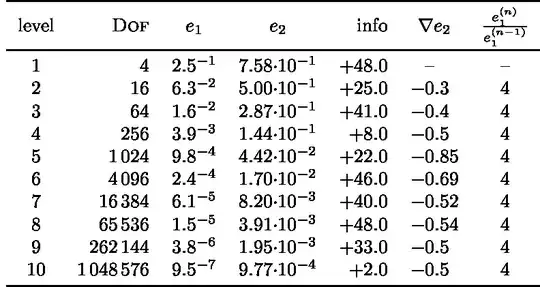
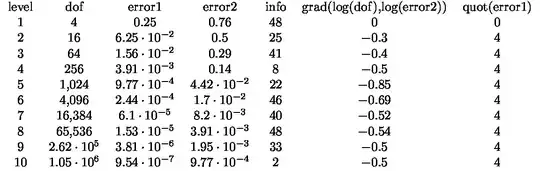
level   dof     error1  error2  info    grad(log(dof),log(error2))      quot(error1)
1       4       2.50000000e-01  7.57858283e-01  48      0               0
2       16      6.25000000e-02  5.00000000e-01  25      -3.00000000e-01 4
3       64      1.56250000e-02  2.87174589e-01  41      -3.99999999e-01 4
4       256     3.90625000e-03  1.43587294e-01  8       -5.00000003e-01 4
5       1024    9.76562500e-04  4.41941738e-02  22      -8.49999999e-01 4
6       4096    2.44140625e-04  1.69802322e-02  46      -6.90000001e-01 4
7       16384   6.10351562e-05  8.20091159e-03  40      -5.24999999e-01 4
8       65536   1.52587891e-05  3.90625000e-03  48      -5.35000000e-01 3.99999999e+00
9       262144  3.81469727e-06  1.95312500e-03  33      -5.00000000e-01 4.00000001e+00
10      1048576 9.53674316e-07  9.76562500e-04  2       -5.00000000e-01 4.00000001e+00

The most basic way to typeset this into a table:

\documentclass{article}

\usepackage{pgfplotstable}

\begin{document}
\pgfplotstabletypeset{pgfplotstable.dat}
\end{document}

enter image description here

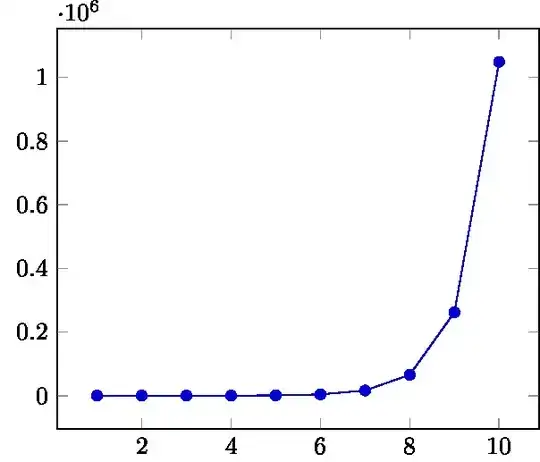
A more advanced example loading the data into a macro for reuse or manipulation before typesetting. This also formats the data and headers of the table using the booktabs package. Finally, this also plots the dof against the level data.

\documentclass{article}

\usepackage{booktabs}
\usepackage{pgfplots, pgfplotstable}

\pgfplotstableset{% global config, for example in the preamble
% these columns/<colname>/.style={<options>} things define a style
% which applies to <colname> only.
    columns/dof/.style={int detect,column type=r,column name=\textsc{Dof}},
    columns/error1/.style={
        sci,sci zerofill,sci sep align,precision=1,sci superscript,
        column name=$e_1$,
      },
    columns/error2/.style={
        sci,sci zerofill,sci sep align,precision=2,sci 10e,
        column name=$e_2$,
      },
    columns/{grad(log(dof),log(error2))}/.style={
        string replace={0}{}, % erase ’0’
        column name={$\nabla e_2$},
        dec sep align,
      },
    columns/{quot(error1)}/.style={
        string replace={0}{}, % erase ’0’
        column name={$\frac{e_1^{(n)}}{e_1^{(n-1)}}$}
      },
    empty cells with={--}, % replace empty cells with ’--’
    every head row/.style={before row=\toprule,after row=\midrule},
    every last row/.style={after row=\bottomrule}
  }

\begin{document}
% Read the file into a macro and use this to typeset the table
\pgfplotstableread{pgfplotstable.dat}{\loadedtable}
\pgfplotstabletypeset[ % local config, applies only for this table
    1000 sep={\,},
    columns/info/.style={
        fixed,fixed zerofill,precision=1,showpos,
        column type=r,
      }
  ]
{\loadedtable}
\begin{tikzpicture}
    \begin{axis}
        \addplot table[x=level,y=dof] {\loadedtable};
    \end{axis}
\end{tikzpicture}
\end{document}

enter image description here enter image description here

1132 questions
16
votes
1 answer

Selecting rows to be displayed with pgfplotstable

I have a table, read from a file, and I would like to display only rows which have a specific value in a given column. Here is an ECM: \documentclass{minimal} \usepackage{pgfplotstable} \begin{document} \pgfplotstableread{ num value 1 …
mikael-s
  • 395
14
votes
3 answers

Pgfplotstable header in bold

I want to create a table using the pgfplotstable package. I've managed to get 95% of the formatting I want using the following: \usepackage{pgfplotstable} \usepackage{booktabs} % global settings \pgfplotstableset{ after row={\hline}, every head…
morcillo
  • 995
13
votes
1 answer

Import files with pgfplotstable and split tables across multiple pages

I am using pgfplotstable to import files with many rows and columns with which to create custom tables. Some tables are quite long, covering many pages. Is there a way to automatically assign the number of rows to display on a page? I could not find…
zun
  • 814
12
votes
1 answer

Create a contingency table using pgfplotstable

I'm trying to create a general pgfplotstable style for displaying contingency tables (the below example is taken from Wikipedia) of any sort but I am having trouble computing the totals for each row and column and adding them to the table on the…
ThomasH
  • 942
11
votes
3 answers

Is it possible to make a pgfplotstable smaller? Reduce spaces and maybe draw vertical lines between columns?

My table is too big and won't fit a page, so I wanted it to be a little smaller. Maybe reduce spaces between each column and draw a line instead. Adding column type/.add={|}{}% results in '|c' put the vertical lines and the table looked better,…
hfingler
  • 641
10
votes
1 answer

Can I use | as column separator in pgfplotstable?

I want to use | as column separator in the CSV file. Because it looks clean, so I won't feel headache to edit the CSV file directly. I have checked the manual, it seems the option col sep accepts only a few values: comma for ,, semicolon for ;,…
Lenik
  • 1,075
10
votes
1 answer

Pgfplotstable without headings row

I would like to typeset a table with a multicolumn heading only. Here is my current attempt \documentclass{article} \usepackage{pgfplotstable} \usepackage{booktabs} \usepackage{array} \usepackage{colortbl} \begin{document} \pgfplotstabletypeset[col…
M. Toya
  • 3,227
10
votes
1 answer

Pgfplotstable: how can I add percent signs (and respect dec sep align)?

My data contains a column with numbers like 0.01 or 0.9412 which I want to display as 1.00% and 94.12% . I would like to declare the column by means of dec sep align. How can I do that? [This question arose after the answer for PGFplotstable: Is it…
9
votes
1 answer

PGFPlotsTable formatting problems

I am having a real hard time trying to format a simple numeric table with PGFPlotsTable. I have tried tons of combinations of TeX.SO solutions, I just cannot get any working result. The table looks like the…
jlandercy
  • 195
9
votes
2 answers

\sffamily with \pgfplotstable

I'm trying to create a table using pgfplotstable. It works almost fine, just asking myself why \sffamily in front of \pgfplotstabletypeset is not working.
john
  • 91
8
votes
1 answer

Midrule before a not empty cell with pgfplotstable

Is it possible with pgfplotstable to check if a cell is not empty and put a \midrule before this row? For example I have the names of a sample in the first column and before every new sample I want a \midrule. If every sample has the same amount of…
Schewerle
  • 367
8
votes
1 answer

! Missing # inserted in alignment preamble

I have a problem in compiling my tex file using nle.cls document class. The problem seems to be with package pgfplotstable. If I comment it our every thing works fine. The package disrupts the working of maketitle. Here is the warning that I get: !…
Riyaz
  • 237
  • 2
  • 9
8
votes
1 answer

Add rows for sum/mean/std at end of pgfplotstable

How do you add a one or multiple rows at the bottom of a table in pgfplotstable that is a summation/average/variance or other function of the above data in that particular column? How can this be done for just some of the columns in a table?
Godisemo
  • 255
8
votes
2 answers

The index of head row doesn't begin with 1

This seems a very simple question, but I cannot find an answer. I have a very simple CSV file and I want to make a LaTeX table from it. tiny.csv -1, 1, -1, 1 2, 4, 6, 8 3, 9, 27, 81 LaTeX…
7
votes
1 answer

Create square and custom size cells in a table using pgfplotstable

I'm trying to create something like a confusion matrix of several classes. Thus, I want to display only the shades of the values. I manage to do it using…
adn
  • 11,233
1
2 3
12 13