1

How to plot a Hyperbolic paraboloid in a style of the attached figure using only one COLOUR enter image description here

Modify my Code please

   \documentclass{article}
\usepackage{pgfplots}

\begin{document}

\begin{figure} \centering \begin{tikzpicture} \begin{axis}[ xlabel=$x$, ylabel=$y$, zlabel=$z$, view={60}{30}, ] \addplot3[surf, shader=interp, domain=-2:2, samples=41] {x^2/4 - y^2/9}; \end{axis} \end{tikzpicture} \caption{Hyperbolic Paraboloid: $z = \frac{x^2}{4} - \frac{y^2}{9}$} \end{figure}

\end{document}

math131
  • 149
  • Does "white" count as a color? – John Kormylo Oct 12 '23 at 13:45
  • @JohnKormylo Assuming white is not a color – math131 Oct 12 '23 at 18:39
  • @JohnKormylo Please suggest how to plot it – math131 Oct 13 '23 at 03:51
  • I think that addplot3 with surf draws the graph of a function defined on a rectangle. In your attached image, the surface is such a graph but with the Oz axis clipped. I don't know if this is possible with addplot3. In case it is not and you really need that type of representation, I guess you have to do it directly in TikZ where you control the domain of the parametrization (for example the y domain will depend of each x in the x domain). – Daniel N Nov 14 '23 at 05:51

2 Answers2

1

enter image description here

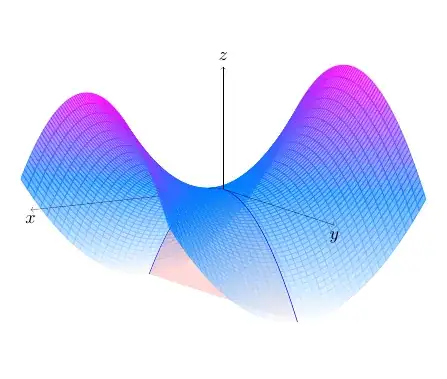
One solution would be to split the paraboloid in two, to achieve some sort of layering. I did the same thing with the coordinate axes.

I modified the code according to @hpekristiansen kind remark concerning the compatibility of the coordinate systems of pdfplots and tikz.

The code

\documentclass[11pt, margin=10pt]{standalone}
\usepackage{pgfplots}
\pgfplotsset{compat=1.17}
\begin{document}

\begin{tikzpicture} \pgfplotsset{set layers} \begin{axis}view={150}{12}, axis lines=none] \addplot3[ surf, colormap/cool, shader=flat, opacity=.6, domain=-4:4, domain y=-4:0, samples=40, clip=false ] {x^2 -y^2};

% plane section x = 0
\addplot3[%
draw=blue, very thin,
fill=red, fill opacity=.15,
domain=-4:4,
samples y=0
] (0, x, {-x^2});

\draw[ultra thin, ->] (0, 0, 0) -- (6, 0, 0)
node[below, text=black, scale=.8] {$x$};

\addplot3[
surf,
colormap/cool,
shader=flat,
opacity=.6,
domain=-4:4,
domain y=0:4,
samples=40,
clip=false
] {x^2 -y^2};

\addplot3[%
draw=blue, very thin,
domain=0:4,
samples y=0
] (0, x, {-x^2});

\draw[ultra thin, ->] (0, 0, 0) -- (0, 0, 18)
node[above, text=black, scale=.8] {$z$};
\draw[ultra thin, ->] (0, 0, 0) -- (0, 6, 0)
node[below, text=black, scale=.8] {$y$};

\end{axis} \end{tikzpicture}

\end{document}

Daniel N
  • 5,687
  • +1 Remember to always set the compat level when using PGFPlots. Do not use explicit axis cs: -it is the default coordinate system since many versions ago. – hpekristiansen Nov 15 '23 at 09:09
  • Thank you @hpekristiansen I shall try your indications tonight to see if I understand them correctly. If I use, say \pgfplotsset{compat=1.??}, then I can write \draw (0, 0, 0) ... instead of \draw (axis cs: 0, 0, 0) ..., isn't it? – Daniel N Nov 15 '23 at 10:31
  • Yes - exactly. Use preferably 1.18 if your system is up to date or a version not too old. If you do not you get a warning when you compile. See https://tex.stackexchange.com/a/139695/8650 – hpekristiansen Nov 15 '23 at 10:52
0

The image you show does not match the hyperboloid calculated.

See section 5.2 (page 425) of the pgfplots manual.

\documentclass{article}
\usepackage{pgfplots}
\usepgfplotslibrary{colorbrewer}

\begin{document}

\begin{figure} \centering \begin{tikzpicture} \begin{axis}[ xlabel=$x$, ylabel=$y$, zlabel=$z$, view={60}{30}, colormap/PuBu-9 ] \addplot3[surf, shader=interp, domain=-2:2, samples=41] {x^2/4 - y^2/9}; \end{axis} \end{tikzpicture} \caption{Hyperbolic Paraboloid: $z = \frac{x^2}{4} - \frac{y^2}{9}$} \end{figure}

\end{document}

John Kormylo
  • 79,712
  • 3
  • 50
  • 120
  • Thank you. I want to reproduce the above Fig that I have attached. It will help me to plot other Figs of conicoids or quadrics. Please help... – math131 Oct 13 '23 at 17:33
  • You can do a lot by changing the viewing angles, and reversing the signs. The shown image is not using an orthogonal 3D grid either. (the y axis should be sloped, or the x axis should point directly to the POV). – John Kormylo Oct 13 '23 at 19:41