I want to draw a chart using a table using Pgfplots.
\documentclass{article}
\usepackage{tikz}
\usepackage{pgfplots}
\usepackage{filecontents}
\begin{filecontents}{data1.txt}
x y
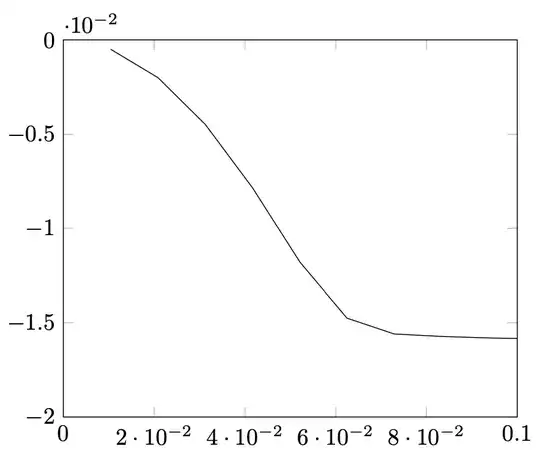
0.01042 -4.98E-04
0.02084 -2.006E-03
0.03126 -4.487E-03
0.04167 -7.852E-03
0.05209 -1.179E-02
0.0625 -1.476E-02
0.07292 -1.56E-02
0.08334 -1.573E-02
0.09376 -1.581E-02
0.10417 -1.586E-02
0.11459 -1.592E-02
\end{filecontents}
\begin{document}
\begin{tikzpicture}
\begin{axis}[
ymin=-0.02, ymax =0.0,
xmin=0.0, xmax =0.1,
]
\addplot[] table {data1.txt};
\end{axis}
\end{tikzpicture}
\end{document}
Now, the output looks like this.
However, I want to multiply y axis step values by 100 without modifying the data itself, and want something like this.

Is there any way to do this? To clarify the context, in my original data, y is in metre, but the values are so small that I want to change it to centimetre.
