Four values are needed to normalize both axes of the table:
the maximum and minimum values of columns a and b.
Since column a is ordered sequentially, it is easy to get its first and last value, and therefore the minimum and maximum value by various methods. For example see Normalize by the i-th value of a series done by scanning a database.
With column b there is another story. The normal approach is to load a database or a table, sort the column in descending order and then retrieve the first and last value. Sometimes there are memory limitations with large tables for the sorting. Or scan the table from beginning to end to locate the maximum and minimum values (slower but does not use much memory).
The bad news is that this takes time, especially with 10K or more rows, and has to be repeated every time the figure or document is compiled.
(Of course you can do it once, and save the plot as a .pdf to incorporate it as such in the document, in a similar way externalize works.)
This table was generated by a system outside of LaTeX, probably as output of a data acquisition system or as a query to a statistical database or the result of a simulation, etc. and exported to Tikz. In a few systems I knew those external systems could be instructed to provide maxima, minima, date, total run time, ID, and other relevant data as metadata that accompanies the raw data.
If this is not possible you might did what I did for this example: loaded the data into excel (renamed as I100-3.txt, because it is easier the import to excel) and sorted the columns one at a time, retrieving their maximum and minimum values. Total time: 30 sec, to be done only once.
For a more automated approach, see the code at the end.
Note: To use another directory as output, for example the subdirectory OutputDir of the working directory, the syntax would be
pdflatex.exe -synctex=1 -interaction=nonstopmode -shell-escape -output-directory=./OutputDir/ <filename>.tex
(only one dash before output)

\documentclass[final]{scrreprt}
%%\usepackage{filecontents} % not needed
\usepackage{pgfplots}
\pgfplotsset{compat=newest}
% **********  Had them before, outside of LaTex
\newcommand{\Minia}{20}
\newcommand{\Maxa}{139.99}
\newcommand{\Minib}{346}  % a = 56.51
\newcommand{\Maxb}{1416} % a = 39.09
%%************************
\begin{document}
\tikzset{mark options={mark size=0.1}}
\begin{figure}
    \centering
    \begin{tikzpicture}
        \begin{axis}
            \addplot table [only marks,
            x index = {0}, y index = {1},
            y expr  = (\thisrowno{1}-\Minib)/(\Maxb-\Minib),
            x expr  = (\thisrowno{0}-\Minia)/(\Maxa-\Minia),
            col sep = space,
            skip first n=1,
            ] {I100-4.csv};
        \end{axis}
    \end{tikzpicture}
\end{figure}
\end{document
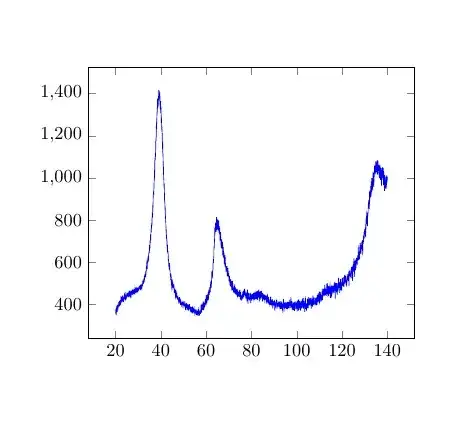
As a reference, the original data is shown, before normalization.
Instead of using excel the package pgfplotstable is quite able to to the job.
This is a transcription of the code taken from math-operations-on-loaded-data
It does his job in approx. 250 sec (12K rows table) in a medium range PC. Scans the table twice and outputs the maximum and minimum values of each column.
The figure could be added to the page as a reference.

\documentclass{article}
\usepackage{pgfplots}
\usepackage{pgfplotstable}
\pgfplotsset{compat=newest}
\newcommand{\Minia}{}
\newcommand{\Maxa}{}
\newcommand{\Minib}{}

\newcommand{\Maxb}{}
\newcommand{\findminmax}[1]{% https://tex.stackexchange.com/a/442061/161015
    \pgfplotstablegetrowsof{\mytable}
    \pgfmathtruncatemacro{\numrows}{\pgfplotsretval-1} % because the tabla has header row
    \typeout{\numrows\space data rows; column-> #1}% keep the user informed
    \pgfplotstablegetelem{1}{#1}\of{\mytable}
    \pgfmathtruncatemacro{\mymax}{\pgfplotsretval} % initial value
    \pgfmathtruncatemacro{\mymin}{\pgfplotsretval}
    \pgfplotsinvokeforeach {1,...,\numrows}{% scans all rows from column #1
        \pgfplotstablegetelem{##1}{#1}\of{\mytable}
        \pgfmathsetmacro{\mymax}{max(\pgfplotsretval,\mymax)} % choose the higher value
        \pgfmathsetmacro{\mymin}{min(\pgfplotsretval,\mymin)} % choose the lower value
    }
    \typeout{final mini found:\space\mymin} % keep the user informed
    \typeout{final max found:\space\mymax}
    \ifnum#1=0 \xdef\Minia{\mymin}\xdef\Maxa{\mymax}\fi % broadcast
    \ifnum#1=1 \renewcommand{\Minib}{\mymin}\renewcommand{\Maxb}{\mymax}\fi
}
\begin{document}
    \pgfplotstableread[skip first n=1, x index=0, y index=1, col sep=space]{I100-3.csv}\mytable
\findminmax{0}

\section{Ref: run I100-3.csv}

\noindent Rows = \numrows

\noindent Min a = \Minia

\noindent Max a =  \Maxa

\findminmax{1}

\noindent Min b = \Minib

\noindent Max b = \Maxb

%%% ************************** uncomment the following lines to add the figure
%%% **************************
    %\begin{figure}[ht!]
    %\tikzset{mark options={mark size=0.1}}
    %   \centering
    %   \begin{tikzpicture}
    %       \begin{axis}
    %           \addplot table [only marks,
    %           x index = {0}, y index = {1},
    %           y expr  = (\thisrowno{1}-\Minib)/(\Maxb-\Minib),
    %           x expr  = (\thisrowno{0}-\Minia)/(\Maxa-\Minia),
    %           col sep = space,
    %           skip first n=1,
    %           ] {I100-3.csv};
    %       \end{axis}
    %   \end{tikzpicture}
    %\end{figure}


\end{document}


filecontentsto include an adequate extract of your data into your example (see minimal working example (MWE) below section Data). – dexteritas Nov 29 '21 at 19:44