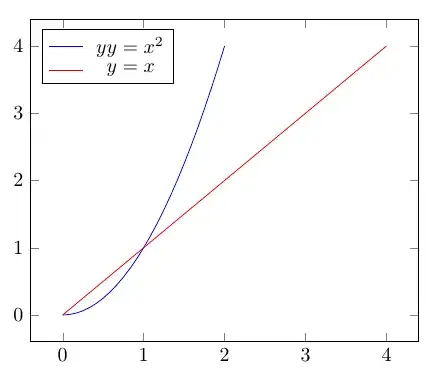
It's not really clear to me exactly what you want. Is this it? (I added colours so it's possible to distinguish the lines.)
It appears that even with two lines in the aligned, the node in the legend matrix has the height of a single line. I don't know why this happens. The workaround below is to first use \begin{aligned}[t] which places the first line of the aligned on the baseline. This makes the first line in the aligned align with the first plot in the legend.\
The next key thing to do is to add more legend entries, one for each additional plot. You don't want more text in the legend, but you want something that makes the nodes as high as they would be if there were text there. So add a \strut, this is a zero width box with some height (and depth).
Hence, if you have two plots, then use \legend{$\begin{aligned}[t]...\end{aligned}$, \strut }. If you have three plots, use \legend{$\begin{aligned}[t]...\end{aligned}$, \strut, \strut}. And so on.

\documentclass{standalone}

\usepackage{pgfplots}
\pgfplotsset{compat=newest}
\usepackage{amsmath}

\begin{document}


\begin{tikzpicture}
\begin{axis}[
legend cell align=left,
legend style={legend pos=north west}
]
  % added colours to plots
  \addplot[blue,domain=0:2] {x^2};
  \addplot[red,domain=0:4] {x};
  \legend{
    $\begin{aligned}[t]
    yy&=x^2\\[-2pt]
    y&=x
    \end{aligned}$,
    \strut % second legend entry
  }
\end{axis}
\end{tikzpicture}
\end{document}
A different approach
A different way altogether could be to do the alignment manually. Here I defined a macro \LHS (left hand side) with an optional and a mandatory argument. You use the optional argument to set the width of the LHS of the equations (default 1.5em), and the mandatory one holds the text/symbols that is the LHS. It makes a box of a fixed width, which makes the = aligned, and is used like this: \legend{$\LHS{yy}=x^2$,$\LHS{y}=x$}.
\documentclass{standalone}

\usepackage{pgfplots}
\pgfplotsset{compat=newest}
\usepackage{mathtools}
\newcommand{\LHS}[2][1.5em]{\hspace{#1}\mathllap{#2}}

\begin{document}


\begin{tikzpicture}
\begin{axis}[
legend cell align=left,
legend style={legend pos=north west}
]
  % added colours to plots
  \addplot[blue,domain=0:2] {x^2};
  \addplot[red,domain=0:4] {x};
  \legend{
    $\LHS{yy}=x^2$,
    $\LHS{y}=x$
  }
\end{axis}
\end{tikzpicture}
\end{document}


\struts are mentioned, in this case it's just an easy way of getting an empty legend entry with a full height node. – Torbjørn T. Jul 10 '18 at 20:23alignedregardless of[t], so you wouldn't have to do anything special. I don't know (and haven't at this point tried to find out) whatpgfplotsdoes exactly that changes it. – Torbjørn T. Jul 10 '18 at 20:40,\strutafter the\strutthat is currently there. – Torbjørn T. Jul 10 '18 at 21:42