The following example uses some internals to define a coordinate system with options rang for the number of the axes and the value. Then the labels are placed at appropriate locations. The example also hacks into \tkzKiviatLine to remember the value list that is needed in the second example.
\documentclass[border=10pt]{standalone}
\usepackage[usenames,dvipsnames]{xcolor}
\usepackage{tkz-kiviat,numprint,fullpage}
\usetikzlibrary{arrows}
\usetikzlibrary{calc}
\usetikzlibrary{positioning}
\thispagestyle{empty}
\makeatletter
\let\org@tkz@KiviatLine\tkz@KiviatLine
\def\tkz@KiviatLine[#1](#2,#3){%
\def\KiviatValues{#2,#3}%
\org@tkz@KiviatLine[{#1}]({#2},{#3})%
}
\newcommand*{\KiviatRadial}{\tkz@kiv@radial}
\define@key{kiviatkeys}{rang}{\pgfmathsetmacro\kiviat@rang{#1}}
\define@key{kiviatkeys}{value}{\pgfmathsetmacro\kiviat@value{#1}}
\tikzdeclarecoordinatesystem{kiviat}{%
\setkeys{kiviatkeys}{#1}%
\pgfpointpolarxy{%
360/\tkz@kiv@radial*\kiviat@rang
}{%
\kiviat@value*\tkz@kiv@gap*\tkz@kiv@step
}%
}
\makeatother
\begin{document}
\begin{tikzpicture}
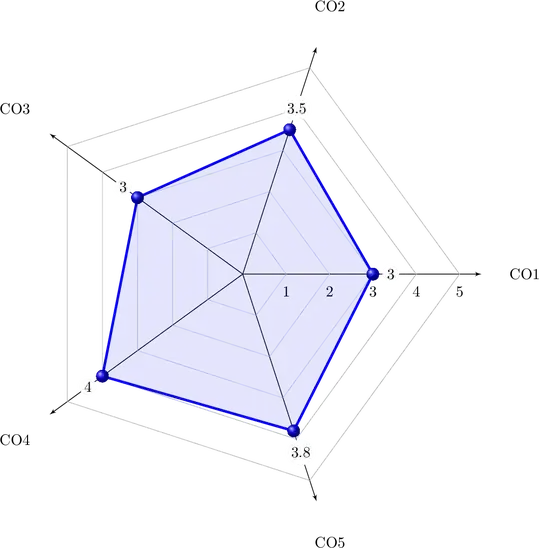
\tkzKiviatDiagram[
radial = 5,
gap = 1,
lattice = 5,
]{CO1,CO2,CO3,CO4,CO5}
\tkzKiviatLine[
ultra thick,
color=blue,
mark=ball,
mark size=4pt,
fill=blue!20,opacity=.5,
](3,3.5,3,4,3.8)
\tkzKiviatGrad[prefix=,unity=1](5)
\def\x(#1,#2)[#3]{%
(kiviat cs:rang=#1, value=#2) node[#3] {#2}%
}
\path
\x(0, 3)[above right]
\x(1, 3.5)[above left]
\x(2, 3)[below left=-.2em and .2em]
\x(3, 4)[below=.3em]
\x(4, 3.8)[below right=-.1em and .1em]
;
\end{tikzpicture}
\end{document}

An algorithm that looks for the optimal placement of the labels is much more
cumbersome. The axis angle, the value, the size of the label, the connecting lines to the neighboring points have to be taken into account. Therefore, the following example is just a first step that simply places the labels near the points on the axes in the outside direction.
\path
  \foreach \v [count=\rang from 0] in \KiviatValues {
    ($(kiviat cs:rang=\rang, value=\v)!-.55em!(0, 0)$)
    node[
      anchor=360/\KiviatRadial*\rang-180,
      circle,
      inner sep=.1em,
      fill=white,
    ] {\v}
  }
;
The same with the normal white background:


anchorand added a white background. – Heiko Oberdiek Jul 29 '17 at 11:00