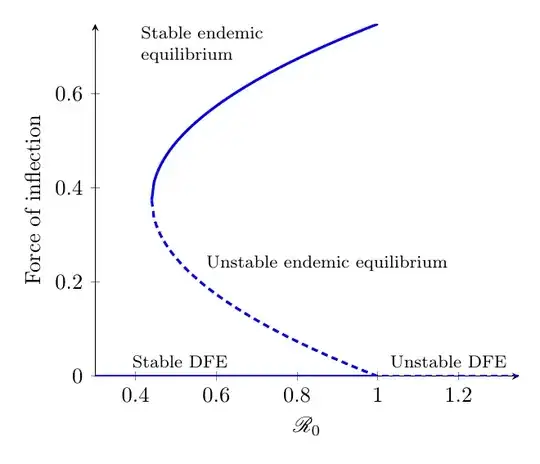
I would use pgfplots. The parabola you are plotting is obviously not the same as the one shown in the image, but I have not tried to work out the correct equation. That I leave to you.
I added some comments in the code.
Regarding the compat setting, see if Dos and Don'ts of \pgfplotsset{compat=newest} and What does "running in backwards compatibility mode" mean and what should I fix to get rid of it? are useful.
\documentclass[border=5mm]{standalone}
\usepackage{mathrsfs} % provides \mathscr
\usepackage{pgfplots}

\begin{document}
\begin{tikzpicture}[
  % define two styles to use for the different parts of the plot
  stable/.style={blue,very thick},
  unstable/.style={stable,densely dashed},
  % for the nodes
  desc/.style={font=\footnotesize,black}
]
\begin{axis}[
 % set domain -- starts at 0.44 because you can't have square roots of negative numbers
 domain=0.44:1,
 % number of samples for plots
 samples=100,
 % default is axis lines on all four sides
 axis lines=left,
 % specify axis limits
 ymin=0,
 xmin=0.3,xmax=1.35,
 % add axis labels
 ylabel={Force of inflection},
 xlabel={$\mathscr{R}_0$},
]

% plot upper part of parabola
\addplot [stable] {0.374+0.5*(-0.44+x)^(1/2)}
  % add a node 80% along the way of the parabola
   node[above left,pos=0.6,desc,align=left] {Stable endemic\\equilibrium};
% plot lower part of parabola
\addplot [unstable] {0.374-0.5*(-0.44+x)^(1/2)}
  % and add node again
  node[above right,pos=0.3,desc] {Unstable endemic equilibrium};


% draw the solid line for "stable DFE"
\draw [
 % use same style as for plot
 stable]
 % rel axis cs: means that (0,0) is the lower left corner of the axis, and (1,1) the upper right
 % axis cs: means that axis coordinates are used
 % with \pgfplotsset{compat=1.11} or newer, axis:cs is the default, and then you don't need to say it explicitly
 (rel axis cs:0,0) -- (axis cs:1,0)
  node [above,pos=0.3,desc] {Stable DFE};

% draw line for unstable DFE.
\draw [unstable] (rel axis cs:1,0) -- (axis cs:1,0)
  node [above,pos=0.5,desc] {Unstable DFE};
\end{axis}
\end{tikzpicture}
\end{document}


\pgfplotsset{compat=1.14}? – Maryà May 10 '17 at 11:420.38+0.5*(-0.44+x)^(1/2)and0.38-0.5*(-0.44+x)^(1/2)– Maryà May 10 '17 at 12:46