I would like to plot a rational function in LaTeX. I tried different ways with Tikz or pgfplots... nothing works. There are many different ways. Often there are problems with poles / asymptotes etc.
\frac{1}{x^2 - 7x - 30}
I'm looking for an easy way of plotting, but I also like the design of \usetikzlibrary{datavisualization.formats.functions} which gives me many useful graphical options.
Thank you
--
Some of my code:
\documentclass[13pt,a4paper,headlines=6,headinclude=true]{scrartcl}
\usepackage{tikz,pgfplots}
\usetikzlibrary{datavisualization.formats.functions}

\begin{document}
\begin{tikzpicture}[yscale=.5, xscale=.5, scale=2]
\datavisualization
[school book axes,
legend={below,rows=1},
visualize as smooth line/.list={f1},
f1={style=blue, style=very thick,label in legend={text=$\frac{1}{x-1}$}},
%f2={style=green, style=very thick,label in legend={text=$\frac{1}{x^2 - 7x - 30}$}}
]
data [set=f1, format=function] {
var x : interval[-4:0.5];
func y = 1/(\value{x} - 1);
}data [set=f1, format=function] {
var x : interval[1.5:4];
func y = 1/(\value x - 1);
};
data [set=f2, format=function] {
var x : interval[12:20];
func y = 1/(\value{x}^2 - 7 \value{x} - 30);
};
\end{tikzpicture}
\end{document}
This results in

Next step, I now have:
\begin{tikzpicture}[scale=1.5]
  \begin{axis}[axis lines=middle,xmin=-20,xmax=20,ymin=-1.5,ymax=1.5,
    extra x ticks={-2,2},
    xlabel=$\scriptstyle x$,
    ylabel=$\scriptstyle y$,
    tick label style={font=\tiny},
    legend style={font=\small,legend pos=outer north east,}]
    \addplot+[no marks,blue,domain=-15:0.8,samples=150, thick] {1/(x - 1)};
        \addplot+[no marks,blue,domain=1.2:15,samples=150, thick] {1/(x - 1)};
    \addlegendentry{$\frac{1}{x-1}$}
    \addplot+[no marks,red,domain=-15:-3.02,samples=150, thick] {1/((x)^2 - 7*x-30)};
    \addplot+[no marks,red,domain=-2.98:9.98,samples=150, thick] {1/((x)^2 - 7*x-30)};
    \addplot+[no marks,red,domain=10.02:15,samples=150, thick] {1/((x)^2 - 7*x-30)};
    \addlegendentry{$\frac{1}{x^2 - 7x - 30}$}
  \end{axis}
\end{tikzpicture}
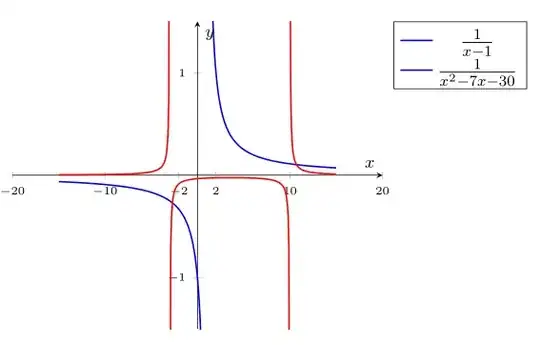
How can I add more numbers in between the xmin/xmax axis interval? For example, write every 2 integers?


