I'm writing a paper and need to insert various tables. I already created a table in Latex and I inserted it into a subsection, but when checking the pdf, the table doesn't appear in that subsection, but at the end of the pdf. The code is the following:
\usepackage{booktabs}
\usepackage{tabularx}
\newcolumntype{Y}{>{\raggedleft\arraybackslash}X}
\begin{table}[htb]
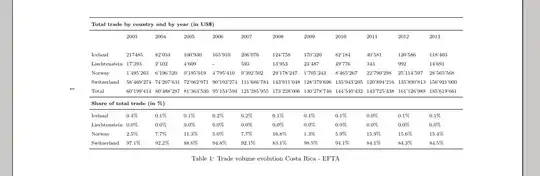
\caption{Trade volume evolution Costa Rica - EFTA}
\label{tbl:tradeevo-costa-efta}
\begin{tabularx}{\linewidth}{l*{6}{Y}}
\toprule
\multicolumn{7}{l}{\textbf{Total trade by country and by year (in US\$)}} \\
\midrule
& 2003 & 2004 & 2005 & 2006 & 2007 & 2008 & 2009 & 2010 & 2011 & 2012 & 2013 \\[0pt]
& & & & & & & & & & &\\
Iceland & 217485 & 82'034 & 100'930 & 165'910 & 206'076 & 124'758 & 170'320 & 82'184 & 40'581 & 120'586 & 118'403 \\
Liechtenstein & 17'393 & 2'102 & 4'609 & - & 593 & 13'953 & 23'487 & 49'776 & 343 & 992 & 14'691 \\
Norway & 1'495'263 & 6'196'520 & 9'195'019 & 4'795'410 & 9'392'502 & 29'178'247 & 1'705'243 & 8'465'267 & 22'790'298 & 25'114'597 & 28'565'568 \\
Switzerland & 58'469'274 & 74'207'631 & 72'062'971 & 90'193'274 & 111'686'784 & 143'911'048 & 128'379'696 & 135'943'205 & 120'894'216 & 135'890'813 & 156'921'000 \\
Total & 60'199'414 & 80'488'287 & 81'363'530 & 95'154'594 & 121'285'955 & 173'228'006 & 130'278'746 & 144'540'432 & 143'725'438 & 161'126'988 & 185'619'661 \\
\end{tabularx}
\begin{tabularx}{\linewidth}{l*{7}{Y}}
\toprule
\multicolumn{7}{l}{\textbf{Share of total trade (in \%)}} \\
\midrule
Iceland & 0.4\% & 0.1\% & 0.1\% & 0.2\% & 0.2\% & 0.1\% & 0.1\% & 0.1\% & 0.0\% & 0.1\% & 0.1\% \\
Liechtenstein & 0.0\% & 0.0\% & 0.0\% & 0.0\% & 0.0\% & 0.0\% & 0.0\% & 0.0\% & 0.0\% & 0.0\% & 0.0\% & \\
Norway & 2.5\% & 7.7\% & 11.3\% & 5.0\% & 7.7\% & 16.8\% & 1.3\% & 5.9\% & 15.9\% & 15.6\% & 15.4\% \\
Switzerland & 97.1\% & 92.2\% & 88.6\% & 94.8\% & 92.1\% & 83.1\% & 98.5\% & 94.1\% & 84.1\% & 84.3\% & 84.5\% \\
\bottomrule
\end{tabularx}
\end{table}
It would be great if someone could help me out with the following issues:
a) The table isn't at the spot I inserted it in, but at the end of the pdf. How can this be changed?
b) As it is a rather wide table, the data doesn't appear sorted. For example, the years (2003 till 2013) should be displayed all in just one row and the 4 countries in just one column. The corresponding numbers should be sorted underneath those years. How can this be changed? Must the table be smaller? Or must it be landscape? Maybe it is too big for just one page?
c) How can the title "Table 1: xxxxxx" be underneath the whole table?
pto the list of location specifiers. The table's placement, though, is going to the be least of your problems. Bothtabularxenvironments should contain far more than 6 or 7 columns of typeY. Separately, do ask yourself what possible informational purpose may be served by reporting the dollar data down to the last$? This likely specious accuracy is virtually assures that the table cannot ever fit inside a normal-width text block. In fact, even insidewaystableformat (and 12 cols of typeY) the table doesn't fit. – Mico Mar 19 '15 at 20:53tableis a floating environment, meaning that LaTeX can move it around e.g. to avoid bad page breaks. See Keeping tables/figures close to where they are mentioned for some options of what you can do. c) Move the\captionand\labelto after thetabularx. – Torbjørn T. Mar 19 '15 at 20:53