4

please excuse my ignorance because I am VERY new to latex (2 days).

Before I ask my basic question, is anyone aware of a beginners guide to creating basic docs in Latex? I have seen a few "cheat sheets" out there but nothing that provides the basics of getting started.

Anyways, here is my question.

I am looking to create a simple line segment, (180 degrees) with arrows on both ends. On this line segment, I would like to plot and label three points, A, B, C.
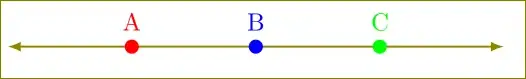
David Hunt
  • 43
  • 1
  • 3
  • Welcome. Take a look here http://www.texample.net/tikz/examples/area/geometry/ – Sigur Sep 05 '14 at 13:21
  • This and linked/related questions (see lists to the right of the answers) may be of interest regarding your initial question: http://tex.stackexchange.com/questions/11/ – Torbjørn T. Sep 05 '14 at 13:33
  • Thank you both for your help, Sigar, the link you provided provides a wealth of information however 99% of the examples are far more complicated than what I am seeking. The one that I have seen that is the closest is in this example, http://www.texample.net/tikz/examples/intersection-of/ but I only need the code would be for Line B with the one Red plot – David Hunt Sep 05 '14 at 13:55
  • @DavidHunt, did you see this http://www.texample.net/tikz/examples/angles-quotes/ ? – Sigur Sep 05 '14 at 14:01
  • yes, that was the first example I looked at, it does not provide any plots – David Hunt Sep 05 '14 at 14:06
  • @DavidHunt, what do you mean by it does not provide...? There is the code and you can copy and paste and change what you need. For example, use \draw[<->] to draw arrow tips on the segments. – Sigur Sep 05 '14 at 14:24
  • With respect to graphics, which is what your question is about, try "A Minimal Introduction to Tikz". – DJP Sep 05 '14 at 14:42

1 Answers1

4

Like this?

\documentclass{article}
\usepackage{tikz}
%\usetikzlibrary{positioning}

\tikzset{
  mynode/.style={fill,circle,inner sep=2pt,outer sep=0pt}
}

\begin{document}
  \begin{tikzpicture}
    \draw[olive,thick,latex-latex] (0,0) -- (7,0)
    node[pos=0.25,mynode,fill=red,label=above:\textcolor{red}{A}]{}
    node[pos=0.5,mynode,fill=blue,text=blue,label=above:\textcolor{blue}{B}]{}
    node[pos=0.75,mynode,fill=green,text=green,label=above:\textcolor{green}{C}]{};
  \end{tikzpicture}
\end{document}

enter image description here