2

I want my document to look like this. It is an extract from the Calculus solutions book by James Stewart.

I would like to know something about the following:

  • fonts (I guess Times New Roman was used.)
  • typesetting (Was LaTeX or rather MS Word used to typeset?)
  • graphics (What kind of graphics package was used?)

It would be even better if someone could remake the page in LaTeX or MS Word, whatever was used.

Picture:

enter image description here

Extract from Calculus, James Stewart.

3 Answers3

1

you must compile with xelatex

\documentclass{article}
\usepackage[margin=2.4cm]{geometry}
\usepackage{multicol}
\usepackage{tikz}
\usepackage{amsmath}
\usepackage[no-math]{fontspec}
\setmainfont{Times New Roman}
\usetikzlibrary{arrows}
\pagestyle{empty}

\setlength{\columnsep}{3cm}
\begin{document}
\begin{multicols}{2}

\begin{enumerate}
\item[9.] $xy=0\Leftrightarrow x=0 \;\text{or}\; y=0.$ the graph consist of the cordinate axes\\

%graph left side==============================================
\begin{tikzpicture}[>=stealth,x=0.5cm,y=0.5cm]
\draw [->] (0,-4) -- (0,4)node[anchor=north east]{$y$};
\draw [->] (-4,0) --(0,0)node[anchor=north east]{$0$}-- (4,0)node[anchor=north east] {$x$};
\draw [<->](0,1.5)--(2,2)--(1.8,0);
\draw (2.3,2) node[fill=white] {$xy=0$};
\end{tikzpicture}%============================================

\item[10.] $|y|=1 \Leftrightarrow y=1 \;\text{or}\; y=-1$\\
\vspace{5mm}

%graph right side=============================================
\begin{tikzpicture}[>=stealth,x=0.5cm,y=0.5cm]
\draw [->] (0,-4) --(0,-2)node[anchor=north east]{$-1$}-- (0,2)node[anchor=north east]{$1$}--(0,4)node[anchor=north east] {$y$};
\draw [->] (-4,0) --(0,0) node[anchor=north east]{$0$}-- (4,0)node[anchor=north east]{$x$};
\draw (2,1) node {$|y|=1$};
\draw (-4,2)--(4,2) (-4,-2)--(4,-2);
\end{tikzpicture}%============================================

\end{enumerate}
\end{multicols}
\begin{enumerate}
\item[11.]By the point-slop form of the equation of a line, an equation of the line throuth $(2,-3)$ with slope $6$ is\\
$y-(-3)=6(x-2)\quad \text{or} \quad y=6x-15.$   
\item[12.]$y-(-5)=-\frac{7}{2}[x-(-3)]\quad \text{or} \quad y=-\frac{7}{2}x-\frac{31}{2}$
\item[13.]The slope of the line throuth $(2,2)$ and $(1,6)$ is $m=\dfrac{6-1}{1-2}=-5$, so an equation of the line is \\
$y-1=-5(x-2)\quad \text{or} \quad y=-5x+11.$
\item[14.]For $(-1,-2)$ and $(4,3)$, $m=\dfrac{3-(-2)}{4-(-1)}=1$.An equation of the line is $y-3=1(x-4)\;\text{or}\; y=x-1.$ 
\end{enumerate}
\end{document}

and you get

enter image description here

Salim Bou
  • 17,021
  • 2
  • 31
  • 76
  • 1
    LuaLaTeX is also fine. If you add \setsansfont{Arial Bold} then you can use \textsf{9.} for enumeration say via enumitem package etc. Also the arrows are stealth but I'm almost sure that this is PSTricks output. – percusse Jul 11 '14 at 21:00
0

I cannot be sure about the following, but

  • it looks to me, as if LaTeX was used to typeset the extract.
  • I would also venture to say that the default LaTeX font Computer Modern or the newer Latin Modern were used.
  • You could certainly create the graphics using Tikz or PGFplots.

You could probably force MS Word to look similar to this, but in my experience LaTeX does a much better job, especially if mathematics are involved.

Chaplin
  • 199
  • Possibly the graphics was made with pstricks (the arrows of the axes lookk like the default arrw shape of pstricks. Easy to make it with pstricks anyway. – Bernard Jul 11 '14 at 21:55
0

Step 1: Preparing the diagrams

Compile the diagram.tex with

latex diagram.tex
dvips diagram.dvi
ps2pdf -dAutoRotatePages=/None diagram.ps

to get diagram.pdf consisting of 2 pages.

% diagram.tex
\documentclass[pstricks,border=12pt,12pt]{standalone}
\usepackage{pst-node,pst-plot}
\usepackage{amsmath}
\begin{document}

\begin{pspicture}(-3,-3)(3,3)
    \psaxes[ticks=none,labels=none]{->}(0,0)(-3,-3)(3,3)[$x$,-90][$y$,180]
    \uput[-135](0,0){$0$}
    \rput[bl](1.5,1.5){\rnode[b]{b}{\rnode[bl]{bl}{$xy=0$}}}
    \psset{nodesep=1pt,arrows=->}
    \pcline(bl)(0,1)
    \pcline(b)(1,0)
\end{pspicture}

\begin{pspicture}(-3,-3)(3,3)
    \psaxes[ticks=none,labels=none]{->}(0,0)(-3,-3)(3,3)[$x$,-90][$y$,180]
    \psplot{-3}{3}{1.5}
    \psplot{-3}{3}{-1.5}
    \uput[-135](0,1.5){$1$}
    \uput[-135](0,0){$0$}
    \uput[-135](0,-1.5){$-1$}
    \rput(1.5,.75){$\lvert y\rvert=1$}
\end{pspicture}

\end{document}

enter image description here

enter image description here

Step 2: Importing the diagrams

Compile main.tex with

pdflatex main.tex

to obtain main.pdf.

% main.tex
\documentclass{article}
\usepackage[a4paper,margin=25mm]{geometry}
\usepackage{multicol}
\columnsep=2cm

\usepackage{amsmath}
\usepackage{enumitem}
\setlist[enumerate,1]{itemsep=12pt,label=\textbf{\arabic*.},start=9}
\usepackage{graphicx}

\begin{document}

\begin{enumerate}
\begin{multicols}{2}
% 1
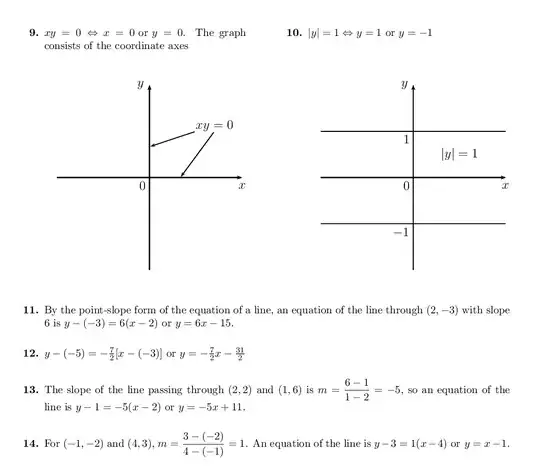
\item $xy=0\Leftrightarrow x=0 \text{ or } y=0$. The graph consists of the coordinate axes
\begin{center}
\includegraphics[page=1]{diagram}
\end{center}
% 2
\item $\lvert y\rvert =1 \Leftrightarrow y=1 \text{ or } y=-1$
\begin{center}
\includegraphics[page=2]{diagram}
\end{center}
\end{multicols}
% 3
\item By the point-slope form of the equation of a line, an equation of the line through $(2,-3)$ with slope $6$ is
$y-(-3)=6(x-2) \text{ or }  y=6x-15$.   
% 4
\item $y-(-5)=-\frac{7}{2}[x-(-3)] \text{ or }  y=-\frac{7}{2}x-\frac{31}{2}$
% 5
\item The slope of the line passing through $(2,2)$ and $(1,6)$ is $m=\dfrac{6-1}{1-2}=-5$, so an equation of the line is 
$y-1=-5(x-2)  \text{ or } y=-5x+11$.
% 6
\item For $(-1,-2)$ and $(4,3)$, $m=\dfrac{3-(-2)}{4-(-1)}=1$. An equation of the line is $y-3=1(x-4) \text{ or } y=x-1$. 
\end{enumerate}

\end{document}

enter image description here

  • 1
    You should have changed your name to James Stewart this time around. :-) The text fonts and enumeration require some adjustment. – Paul Gessler Jul 12 '14 at 21:23