I want create this flowchart. Please help me.
You can use TikZ matrices for this:
\documentclass[border=10pt,tikz]{standalone}
\usetikzlibrary{calc,matrix}
\begin{document}
\begin{tikzpicture}
\matrix (m) [matrix of nodes,
nodes={align=center,text width=2cm},
row sep=2ex]{
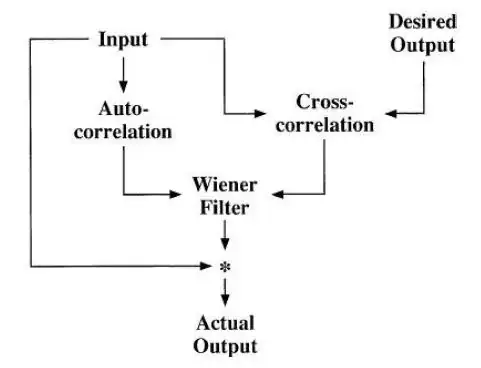
Input & & & {Desired\\ Output}\\
Auto-Correlation & & Cross-Correlation & \\
& Weiner Filter & & \\
& * & & \\
& Actual Output & & \\
};
\begin{scope}[-latex]
\draw ($(m-1-1)!0.5!(m-1-1.west)$)--(m-1-1.west)|-
($(m-4-2.west)!0.5!(m-4-2)$);
\draw ($(m-1-1)!0.5!(m-1-1.east)$)--([xshift=1cm]m-1-1.east)|-
($(m-2-3.west)!0.3!(m-2-3)$);
\draw ($(m-1-4)!0.5!(m-1-4.west)$)--(m-1-4.west)|-
($(m-2-3.east)!0.3!(m-2-3)$);
\draw (m-2-1.south)|-($(m-3-2.west)!0.5!(m-3-2)$);
\draw (m-2-3.south)|-($(m-3-2.east)!0.5!(m-3-2)$);
\draw (m-3-2.south)--(m-4-2.north);
\draw (m-4-2.south)--(m-5-2.north);
\end{scope}
\end{tikzpicture}
\end{document}
The result:

More information about the way to proceed can be found in High level digital design in TikZ.
Weiner Filter with * or * with Actual Output :)
– Claudio Fiandrino
Apr 29 '14 at 12:14