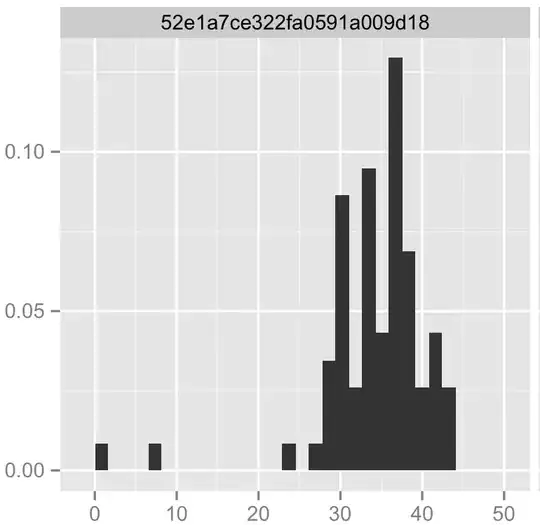
I am designing a points-scored test. There is a limit on the maximum amount of points possible, as well as on the fewest amount of points possible. I have had a test group take the test and graphed their results, which form a lopsided bell curve or sorts. I am trying to figure out what kind of distribution would be best to describe this distribution, for the purpose of using it to calculate percentile scores for any future test takers. I would use normal, but intuitively, I feel that the highest percentiles would never be reached, since they would be beyond the upper bound of the data set. Would a truncated normal distribution or beta distribution be best? Any help, intuitive or direct, would be appreciated. I am mostly working in the R environment.
plot(density(rweibull(100000,shape=9,scale=36)))), but doesn't appear to fit the low observations. Even with a simulated sample of 10M, the lowest observation was 4.6. – Nick Stauner Mar 20 '14 at 02:30plot(density(rgl(10000,med=36,iqr=5,chi=-.5,xi=.6)),xlim=c(0,50))using thegldistpackage). Doesn't handle the lower bound well though, so you'd at least want a lower-bounded version of this. – Nick Stauner Mar 20 '14 at 02:50