I started evaluating and comparing some methods in forecasting. I used Price of dozen eggs in US, 1900–1993, in constant dollars in the R software FMA package. I held out the last 10 years for assessment of forecast. Below are the results:
I used auto arima method in the R software. Obviously the results are way off. Am I doing something incorrect ? Below is the forecast. It does not recognize the declining trend.

I also used an unobserved components model (UCM) and obtained a good forecast, as below.
- Without outliers/level shifts there are very large standard errors and therefore wide confidence bands.

- After some iterative work, below is the output with outliers/level shifts (I know I'm overfitting here) but it did a pretty good job in forecasting; there are also narrow confidence bands.

In looking at just this example the UCM seems to predict the hold-out sample more accurately than auto.arima.
Why is auto.arima not providing a reasonable forecast?
Are state space models/UCMs better for forecasting long range?
Are there any benefits of using one method over other?
 . The test for constancy of parameters revealed a possible breakpoint at or around period 53 (year=1953 note that the UCM model declared a new trend at 1954) which suggests a possible regime change between 1-52 AND 53-83 . This is easily confirmed visually by examining a plot of the data. It is an exponential smoothing model ( a very particuLlar case of an ARIMA MODEL ) with a constant and an adjustment for the 75th data point. The residual plot is suggestive of sufficiency (at least with 31 values)
 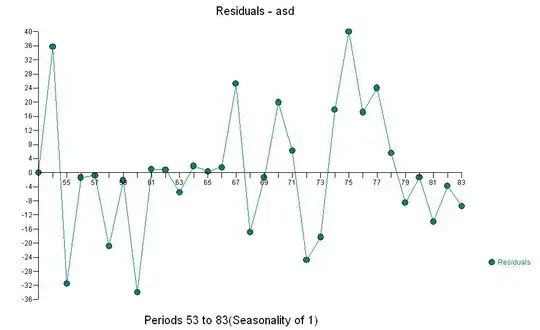 with an ACF of
  . The next plot is the actuals/fit and forecast .
 The assumption that all of the data comes from the same model with constant parameters needs to be verified NOT ignored. Just because we know that 83 values exist DOESN'T mean that we should use all of the data. Modelling the entire series does not necessarily model individual subsets.