I'm fitting a logistic regression model Y ~ X1...X10 to 10,000 observations, where my goal is estimate the effect of each covariate on Y.
My first issue is deciding what transformations to apply to the predictors. They all have very skewed distributions, and in some cases take on very few (<6) values. I included a typical histogram below. Would it make sense to cast them as factors, or otherwise apply some power transformation?
I'm having some trouble diagnosing the model. The fit is quite poor - the classification rate is only 65%, and the deviance is:
Null deviance: 13568  on 9999  degrees of freedom
Residual deviance: 13143  on 9989  degrees of freedom
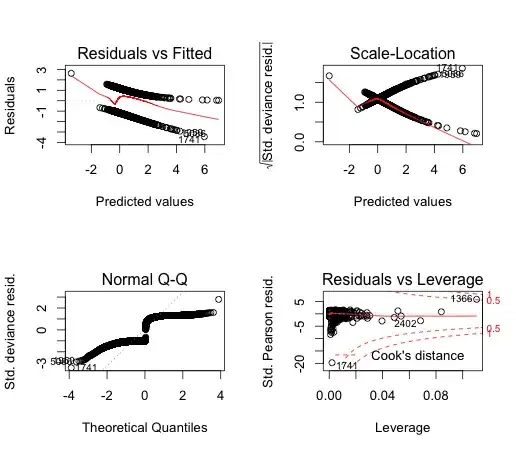
The diagnostic plots shown below seem to suggest:
- There are some very high leverage, high residual points affecting the fit of the model. I think these the points in the tails of the distributions, which don't represent the rest of the data. Would transforming the data solve this problem?
- There residuals are definitely not normally distributed. There is a trend the model fails to capture. How should I find this trend?
- The deviance residuals are definitely not normally distributed.
I guess my main question is how to find a suitable transformation of the data, and the best next step to explaining the remaining variance in the data.

sign(x)*abs(x)^(1/3). (Square roots also work for negative values, but few people want to bring in complex numbers in this context.) – Nick Cox Aug 12 '13 at 08:21