1

I have carried out cluster analysis and now want to compare means between variables in different clusters. The variables in question are age and expenditure in millions of dollars.

The age variable does not follow a normal distribution: as a result, I was considering a Mann-Whitney test. The expenditure in millions of dollars fails the assumption of equality of variances.

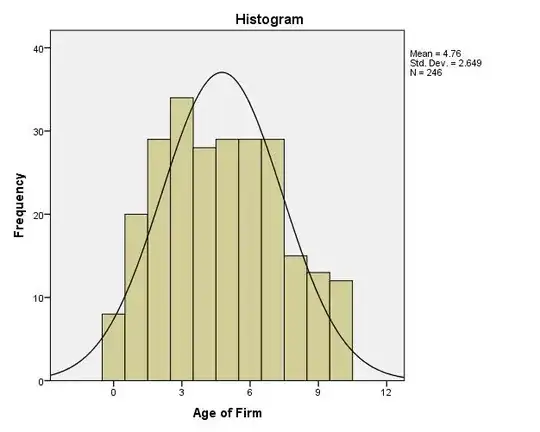
Having stated this, although all tests seem to suggest that age does not follow normal distribution, I am not quite sure about the extent of this.

Histogram Age Cluster 1

Histogram of age in cluster 1

Histogram Age Cluster 2

Histogram of Age in Cluster 2

Box plot of age in cluster 1

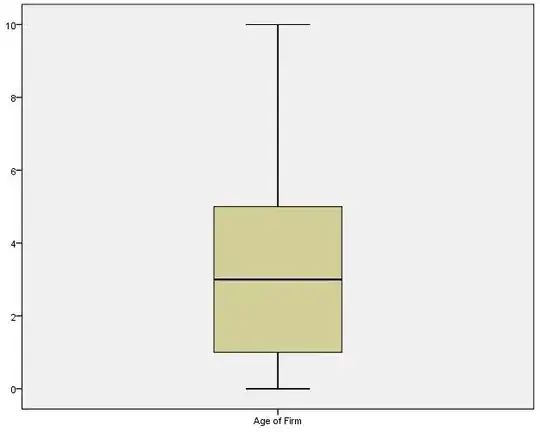
Box plot of Age in Cluster 1

Box Plot - Age - Cluster 2

Box Plot of Age in Cluster 2

It has been suggested to use the Mann-Whitney test in this case, given that the assumption of normality is "not met".

  1. Does Mann Whitney work fine with continuous data? This link seems to suggest it does. Would SPSS automatically convert these into ranks?
  2. Zimmerman argues that t-test should work fine because it is scarcely affected by non-normality of the population!
  3. Sheskin (2007) suggests using a t-test anyway but using a more conservative approach (e.g critical values of t(0.01) instead of t(0.05).

How can I resolve this problem?

Gala
  • 8,501
  • Links to previous questions that might be interesting: http://stats.stackexchange.com/questions/38967/how-robust-is-the-independent-samples-t-test-when-the-distributions-of-the-sampl http://stats.stackexchange.com/questions/2541/is-there-a-reference-that-suggest-using-30-as-a-large-enough-sample-size http://stats.stackexchange.com/questions/53053/mann-whitney-or-two-tailed-t-test http://stats.stackexchange.com/questions/15664/how-to-test-for-differences-between-two-group-means-when-the-data-is-not-normall – Gala Jul 11 '13 at 11:16
  • Zimmerman is quite mistaken except possibly in the special case where $\sigma$ is a known constant. – Frank Harrell Jul 11 '13 at 12:36
  • Zimmerman cites a million others. Are they all mistaken. – Cesare Camestre Jul 11 '13 at 13:02
  • The abstract suggests a more nuanced view. – Gala Jul 11 '13 at 13:05
  • Look particularly at the third line of the article.. – Cesare Camestre Jul 11 '13 at 13:08
  • This is just the introduction, certainly not something Zimmerman “argues”… – Gala Jul 11 '13 at 13:55
  • It is a qualification he is making at the very start. – Cesare Camestre Jul 11 '13 at 14:28
  • @IdiotAbroad That's not the way you should read scientific papers, you should quote it for its main result/argument. – Gala Jul 11 '13 at 15:10
  • I have read the whole paper, what he mentioned there is crucial, and is well referenced. – Cesare Camestre Jul 11 '13 at 15:58

4 Answers4

7

There are many questions on this already, just have a look using the search function. Some details of your questions however seem to warrant some specific remarks:

  • Mann-Whitney U test works fine with continuous data, I would even say it works best with them because you would avoid ties.
  • The t-test has indeed been found robust to some violations of its assumptions but not to all of them, especially if they happen concurrently. Larger sample sizes help to relax these constraints. You can find many information on this elsewhere on this site.
  • Point 3 is surprising. For one, the whole point of a test is to offer some guarantees regarding the error level, provided the assumptions are met. If you can't achieve that, just picking an arbitrary “conservative” level just muddles the situation further. Better give up the test entirely. Furthermore, one common problem with the t-test and non-normal data is lack of power. A lower threshold just makes this problem worse. All this would seem to make the result very difficult to interpret one way or the other.
  • I would generally be skeptical of tests between groups that are not defined a priori, certainly if the variables you are comparing were also used for the cluster analysis. All this sound a bit too exploratory for tests to be meaningful. You might just as well plot the data and comment what you see, understanding that you are just providing a tentative interpretation.

Practical recommendations in light of your comments:

  • Mann-Whitney is perfectly fine but do realize it is not a test of the difference in means. It might or might not be a problem for you but the most important point is that you cannot just think of this problem as “normal data => t-test, non-normal => Mann-Whitney U”. There is a lot more going on (check the links I added as a comment to the question for more on that).
  • The t-test might be fine. I already wrote that a hard-and-fast threshold would be very questionable and it's still impossible to give advice based only on the notion that the data are “non-normal”. Whether it matters or not depends on the specific ways in which they are non-normal.
  • 300 observations is already quite comfortable. Do run both tests, possibly some other alternatives as well (permutation test, bootstrap test of the median or another robust estimator of location if that makes sense…). Also inspect the distribution and the residuals. You might very well find all this point to broadly similar conclusions and would not need to worry about this further.
  • You said that the two variables are not the “main” predictors in the cluster analysis but are they in the analysis at all? I would still not be fully convinced of the value of the whole approach but you should at least keep them entirely separate I think.
  • Don't overestimate tests. Since you are happy using an exploratory method like cluster analysis, do also plot the data and interpret that in any case.
Gala
  • 8,501
  • 1
    This answer and mine were being written simultaneously. They look entirely consistent to me. – Nick Cox Jul 11 '13 at 10:51
  • All three of us were writing at the same time! And all three answers are consistent and somewhat complimentary. – Peter Flom Jul 11 '13 at 10:55
  • I did conduct a search but specific answers to my questions were not provided
  • Point 2 re t test assumptions, - always confused by what you mean by larger samples, each sample has around 300 items in it
  • Point 3 was a quote from the Handbook of Parametric and Non Paramtric Stats by sheskin.
  • – Cesare Camestre Jul 11 '13 at 10:58
  • @NickCox Yes, indeed, but I forgot to mention the fact that Mann-Whitney U compares different hypotheses than the t-test and is not a drop-in “non-parametric” replacement for it as it is sometimes presented, an important point as well. – Gala Jul 11 '13 at 10:59
  • 2
    @Peter Flom. Glad you agree, but you mean complementary... Insert emoticon if desired. – Nick Cox Jul 11 '13 at 11:02
  • 1
    @IdiotAbroad What I mean is that the larger it is, the “nicer” the sampling distribution of the mean even if the distribution of the data is non-normal. It's probably impossible to provide a hard-and-fast threshold which is why you will find a lot of these confusing noncommittal recommendations. – Gala Jul 11 '13 at 11:06
  • I do understand your points here. Let me clarify that these are not the main predictors in the cluster analysis. A priori I would expect differences in the means of these two sub-samples (based on literature). Now given that age does not follow normal distribution - what is the suggestion here. – Cesare Camestre Jul 11 '13 at 11:12
  • The practical recommendations, where what I was after. As to your comment that that t-test might still be fine, I posted a q-norm plot of age, if that helps in anyway to give some more insight. – Cesare Camestre Jul 11 '13 at 11:35
  • 1
    Not sure what to make of this last plot. This variable seems in fact discrete but not so bad, considering. Your last edit suggests that by “non-normal”, you mean you rejected normality in some test; I don't think it matters in the least. In any case, what I would look at are density plots, boxplots or stripcharts of each group/cluster, looking for differences in the shape or variance of the distribution. – Gala Jul 11 '13 at 11:46
  • Gael, I updated the posts and posted some of the plots you suggested. Of concern is probably the box plot of age in cluster 1. – Cesare Camestre Jul 11 '13 at 12:12
  • 1
    @IdiotAbroad I implicitly suggested you look at them… I can't just make the decision for you, without knowing about the project, over some Internet Q&A site. – Gala Jul 11 '13 at 12:15
  • Its not a matter of making a decisions. I just want to gather views as to wether i should use the Mann Whitney or the the t – Cesare Camestre Jul 11 '13 at 12:40