I need to do a regression in R, I want to predict CHI from TETA, first I've made a plot of my data and I obtained

my data are
CHI<- c(19.2430 ,  14.4949,   11.6516,  9.7592,   8.4091,    7.3973,    6.6104,    5.9807,    5.4650,   5.0345,    4.6695,   4.3558,  4.0830,    3.8434,    3.6310,  3.4414,    3.2708,    3.1163,   2.9757,    2.8471,   2.7287,  2.6194,   2.5181,    2.4237,    2.3356,   2.2530,    2.1754,   2.1022,    2.0331,   1.9675,  1.9053,   1.8461,    1.7895,    1.7355,   1.6837 ,   1.6341,   1.5863 ,   1.5404,   1.4960,  1.4532,   1.4117,    1.3716,    1.3326,   1.2947 ,   1.2579,   1.2220,    1.1869,   1.1527,  1.1193,   1.0865,    1.0544,    1.0228,  0.9919,    0.9614,   0.9314,   0.9018,    0.8726,   0.8438,  0.8152,   0.7870,    0.7590,   0.7312,   0.7036,   0.6762,  0.6489,   0.6217,    0.5946,   0.5676,  0.5405,   0.5135,   0.4864,    0.4592,   0.4320,    0.4046,    0.3772,   0.3495,    0.3217,   0.2936,  0.2653,   0.2368,   0.2080,   0.1790,  0.1497,    0.1201, 0.0903,   0.0603,    0.0302)
TETA<- c(0.0524,    0.0698,    0.0873,  0.1047,   0.1222,  0.1396,   0.1571,  0.1745,   0.1920,    0.2094,   0.2269,   0.2443,   0.2618,   0.2793,   0.2967,  0.3142,   0.3316,  0.3491,   0.3665,   0.3840,   0.4014,   0.4189,   0.4363,   0.4538,   0.4712,  0.4887,   0.5061,  0.5236,   0.5411,   0.5585,   0.5760,   0.5934,   0.6109,   0.6283,   0.6458,  0.6632,   0.6807,  0.6981,   0.7156,   0.7330,   0.7505,   0.7679,   0.7854,   0.8029,   0.8203,  0.8378,   0.8552,  0.8727,   0.8901,   0.9076,   0.9250,   0.9425,   0.9599,   0.9774,   0.9948,  1.0123,   1.0297,  1.0472,   1.0647,   1.0821,   1.0996,   1.1170,   1.1345,   1.1519,   1.1694,  1.1868,   1.2043,  1.2217,   1.2392,   1.2566,   1.2741,   1.2915,   1.3090,   1.3265,   1.3439,  1.3614,   1.3788,  1.3963,   1.4137,   1.4312,   1.4486,   1.4661,   1.4835,    1.5010,  1.5184,  1.5359,   1.5533)
(I know they are very few)
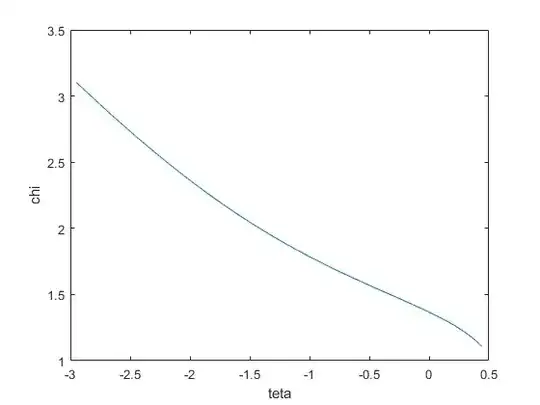
In order to do a linear regression I've tried to transform my variables, in particular, after some attempts I tried with this code:
chi<-log(chi+3)
teta<-log(teta)
because in that way I have this plot
then
df<- data.frame(chi,teta)
model<- lm(chi ~ teta, data=df)
and I obtain

and my residuals are

How can I improve this model? Should I try with a nonlinear regression?