5

I have a dataset with $10$ inputs containing real numbers and an output which is binary ($0$ or $1$), and I need to make predictions. So, I thought of using multiple linear regression to predict an output. If the output is $\geq 0.5$, we can assume the binary output is $1$ and if the output is $< 0.5$, the binary output turns to $0$. Can this thought stand from a mathematical point of view? Does it follow mathematics' rules?

I searched in the Stack Exchange site, and people suggest logistic regression. However, I cannot understand why one would use such complicated mathematics when somebody can use easier formulas?

User1865345
  • 8,202
John
  • 53
  • 8
    Jeremy Miles gave a very good answer. (+1).

    But I don't understand why you would want to do this. Logistic regression is not a particularly complex model, and is designed for this.

    – Peter Flom Sep 15 '23 at 22:59
  • 2
    (1) You may want to invest a little thought into whether a threshold of 0.5 is really what you want; see here. This, by the way, also applies to the output of logistic regression, or indeed of any other probabilistic classifier. This may also be relevant. (2) I hope you have a large amount of data, because ten inputs are a lot of parameters to estimate. – Stephan Kolassa Sep 16 '23 at 08:26

2 Answers2

12

You can. It's called a linear probability model.

Should you? There are a couple of problems. Someone can only score 0 or 1. What does it mean to predict they score 0.5? (Maybe it means 50% probability).

What do you do if you predict someone has a score of 1.1, or -0.5. These can't exist in probability space.

Your residuals cannot be normally distributed, so you've violated that assumption and it's likely that your standard errors are wrong (and so your p-values and 95% CIs are wrong).

You almost certainly violated the homogeneity of variance assumption, so your standard errors are wrong.

I've seen it said that if your outcome variable is not more than 80% in one category or the other, it's not horribly wrong to do a linear probability model. But the computer is doing all the complicated mathematics, so what does it matter if the formulas are complicated. (Multiple linear regression formulas are also pretty complicated).

Edit: This page discusses the model, including how to correct some of the issues: https://murraylax.org/rtutorials/linearprob.html

Jeremy Miles
  • 17,812
  • No, 0.32 for example will be the output of the prediction for some values. And I will assign it to "0" (<0.5). Also I have SD , so even if I get a number like those you mentioned, 1.1 or -0.5, I can somehow assign them to "0" or "1", because I will have a range to move between.. Does this make sense? – John Sep 15 '23 at 22:51
  • Yep, makes sense. I believe that's what is done when people fit these models. – Jeremy Miles Sep 15 '23 at 22:53
  • 3
    A simple answer is the the logistic model is likely to fit the data and a linear model has no chance of fitting the data if there is any range to the predictors. Logistic regression has been around since Cox developed it in 1958 so I'm unclear as to the hesitation to use it.. Plus software abounds. – Frank Harrell Sep 16 '23 at 11:19
  • 1
    @Jeremy Miles: Thank you for your answer! In order to make my LPM compliant with mathematics rules, what modifications/configurations should I do in my model? To be more precise, how do I make my output to be between [0..1]. As I wrote above, I will try to use SD, MSE and define a range for each y_predicted value. Is that ok? – John Sep 18 '23 at 20:53
  • 1
    I'm not really sure by what you mean by 'compliant with mathematics rules'. It's not like there are rules that you will be punished for not obeying. :) It's just how you interpret the results. Why not do logistic regression? – Jeremy Miles Sep 18 '23 at 21:10
  • @Jeremy Miles: Ok with logistic regression, everything fine. I am just interesting to make LPM work under the rules of mathematics. What configurations should I do to the output? Or anything else that I do not see now. I mean it is obvious that if I get an output -0.4 or +1.6 are not probabilities. I thought of working with SD, MSE etc. But is this thought correct? Am I missing something? – John Sep 20 '23 at 20:48
  • 1
    Logistic regression uses log odds of probability. There's no sd, mse. – Jeremy Miles Sep 20 '23 at 23:09
  • @Jeremy Miles: Much appreciated your very helpful advice. I have tested logistic regression, everything works fine. Now I am asking something else. If I need to correct the LPM scheme that I use, what changes should I do to the whole rationale ,in order to be mathematically correct? Because now the output I get with LPM is not mathematically compliant. And of course I ask any other that could help...Thank you... – John Sep 21 '23 at 07:35
  • I'm not sure I understand the question. Perhaps ask a new question that would allow you to elaborate? – Jeremy Miles Sep 21 '23 at 13:02
10

Along with Jeremy's excellent answer, I'll focus on the most relevant bit here:

I searched in the stack exchange site, and people suggest logistic regression. However, I cannot understand why to use so complicated mathematics when somebody can use more easy formulas?

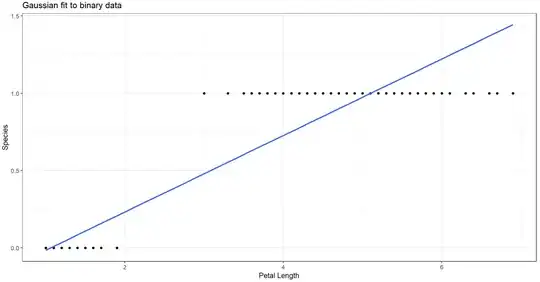
Linear regressions estimated with the assumption of Gaussian errors should have residuals which would have a normally distributed mean and variance $N(\mu,\sigma^2)$. We immediately run into issues with this when we set boundaries to our outcome data. First, predictions will exist outside the bounds of your data and will thus be completely invalid (for example, we can't have a value of $2.5$ or $-2.5$). If we fit an OLS line to binary data, you get something like this, where you see the predicted line passes the data points and leads to this behavior:

enter image description here

If we compare that to the sigmoid curve given by a logistic regression, you can see the line alternatively does not pass beyond the given data like before, so predictions lie completely within $0$ or $1$:

enter image description here

Additionally, as the mean response approaches either $0$ or $1$, the variance shrinks to zero, which will often give you bizarre diagnostic plots like these:

enter image description here

One of the nice properties of logistic regression is that you also get the benefit of some nice probabilities, which are listed in the sigmoid curve plot above.

User1865345
  • 8,202