I am interested in simulated values that follow a certain distributional shape and map them on to values of a certain range.
Here is an example with the beta distribution.
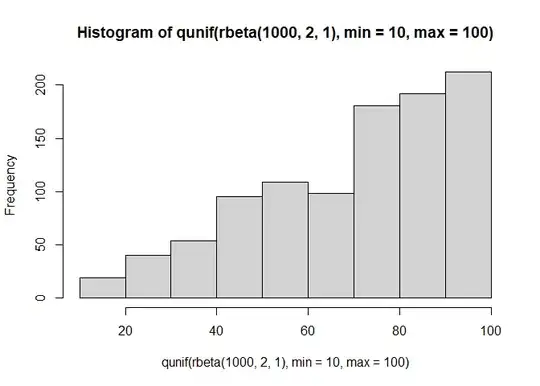
rbeta(1000, 2, 1) |>
  qunif(min = 10, max = 100) |>
  hist()
Created on 2023-08-15 with reprex v2.0.2
I use the beta distribution to generate a distribution of probabilities of a certain shape then map those with the uniform quantile function into the value range I want in this case 10 to 100.
How would I do this with other distributions for example normal or weibull?