TLDR: seems mostly fine, especially if you have more test data.
This answer contains empirical experiments similar to my experiment with PCA here. We'll run a few experiments with BERT and GPT-2 on real classification tasks. BERT is trained on unlabeled text using masked language modeling loss (see section 3.1 Task #1 here1). GPT-2 is trained on unlabeled text using the usual "causal" loss (see equation (1) here2).
Experiment design
Code for this experiment is available here. The experiment procedure is implemented in the function, experiment, here. Here it is written out:
Split a sample into 3 subsamples:
train: 100 observations for supervised/classification trainingtest: $n$ ($200$ or $500$) observations which will be used to report accuracyextra: $n$ observations which are optionally used for unsupervised training.
Compute the following 3 accuracies:
$\text{acc}_{\text{extra}}$: train BERT/GPT-2 on extra features using masked/causal language modeling loss, and then train this model on train features and labels using cross entropy loss by adding a linear layer whose output dimension is the number of classes. (For BERT, the linear layer transforms the [CLS] token embedding. For GPT-2, the linear layer transforms the last token's embedding.) Compute the accuracy of this model on test.
- This score is clearly an unbiased estimator of out-of-sample accuracy because it never trains on data from
test.
$\text{acc}_{\text{test}}$: train BERT on test features using masked language modeling loss, and then train this model on train features and labels using cross entropy loss. Compute the accuracy of this model on test.
- This score represents what you'd see in an ML competition like RAFT. It's unclear whether or not the score is unbiased, because it was trained and evaluated on the same set of
test features. My hypothesis is that it's not unbiased; it's optimistic.
$\text{acc}_{\text{base}}$: don't train BERT using masked language modeling loss; just train it out-of-the-box using cross entropy loss on train features and labels. Compute the accuracy of this model on test.
- This score is a control. If $\text{E}[\text{acc}_{\text{extra}} - \text{acc}_{\text{base}}] = 0$, then we shouldn't be surprised that there's no effect going from $\text{acc}_{\text{extra}}$ to $\text{acc}_{\text{test}}$. Training on unlabeled text doesn't help for this data.
The 3 accuracy estimators are paired, as the supervised training and test sets are identical. The only difference is the source of unsupervised training data. For $\text{acc}_{\text{extra}}$, the source is independent of test set texts. For $\text{acc}_{\text{test}}$, the source is exactly the test set texts. An important source of variation in this experiment is the particular subsample/sample splits, so the experiment procedure was repeated on 50 random subsamples for each dataset for $n = 200$, 20 for $n = 500$.
If The Elements of Statistical Learning3 is right—
initial unsupervised screening steps can be done before samples are left out . . . Since this filtering does not involve the class labels, it does not give the predictors an unfair advantage.
—then $\text{E}[\text{acc}_{\text{test}} - \text{acc}_{\text{extra}}] = 0$, i.e., there is no overestimation of out-of-sample accuracy despite unsupervised training on test.
Results
The experiment was ran on 25 text classification datasets. The dataset inclusion criteria was:
- I'm pretty sure BERT can do better than guessing
- Not a super high number of classes (since the design is limited to a couple hundred observations)
- Texts were not so long that too much useful signal gets truncated to fit in BERT's context window.
Raw accuracy scores are available here.
Analysis
For analyses of individual datasets, see this notebook. For each dataset, that notebook contains a plot like the one below (black line = majority accuracy):

(Note that it's probably ok if accuracies are worse than majority accuracy. The design stratify-samples the 100 classification training observations to ensure every class is represented, and to reduce variance across subsamples. It doesn't stratify-sample the test data. The only statistic we're interested in is the difference between accuracies, which is effectively the difference model likelihoods when the priors are identical. TLDR: all we care about is the difference between accuracies.)
Visualization of differences
Usually, most of the mass of $\text{acc}_{\text{extra}} - \text{acc}_{\text{base}}$ is on the positive side, while $\text{acc}_{\text{test}} - \text{acc}_{\text{extra}}$ is usually centered around 0. An unintended and kinda inevitable source of variance is BERT's training instability.

Model
The model is a multilevel one which stratifies by the type of LM:
$$
\begin{align*}
Y_{ijkl} \sim \text{Binomial}(n, \lambda_{ijkl}) && \text{number of correct predictions} \\
\text{logit}(\lambda_{ijkl}) = \mu + \alpha z_i + U_j + V_{jk} + \beta x_{ijkl} && \text{additive effects} \\
\mu \sim \text{Normal}(0, 1) && \text{prior for intercept} \\
\alpha \sim \text{Normal}(0, 5) && \text{prior for LM type effect} \\
U_j \sim \text{Normal}(0, \sigma_{U}) && \text{effect of dataset} \\
V_{jk} \sim \text{Normal}(0, \sigma_{V}) && \text{(nested) effect of dataset subsample} \\
\beta \sim \text{Normal}(0, 1) && \text{prior for treatment effect} \\
\sigma_{U}, \sigma_{V} \sim \text{HalfNormal}(0, 1) && \text{prior for standard deviations}.
\end{align*}
$$
$n = 200$ or $n = 500$ depending on the dataset of scores you want to analyze. $n = 200$ isn't a strawman, but most test splits are in the 100s. Other research has found that the bias from pretraining / unsupervised pre-processing converges to $0$ as $n \rightarrow \infty$4 (also seen in my answer for PCA). So we should also try $n = 500$.
$i = 1, 2$ for BERT and GPT-2, respectively.
$z_i = 0$ if $i = 1$ else it's $1$.
$j = 1, 2, \dots, 20$ for the dataset.
$k = 1, 2, \dots, 50$ (or $20$ for $n = 500$) for the subsample of dataset $j$.
$l = 1, 2$ for control and treatment, respectively.
$x_{ijkl} = 0$ if $l = 1$ else it's $1$. Inference on $\beta$ is performed via MCMC.
Note: I'm still learning how to do this type of analysis. I'd appreciate feedback.
Posterior predictive distributions
Below are the distributions of $\bar{\hat{Y}}_{\cdot \cdot \cdot 1} - \bar{\hat{Y}}_{\cdot \cdot \cdot 0}$, i.e., the difference between the treatment ($1$) and control ($0$) grand means. The mean is taken across LM types, classification tasks, and their subsamples. We could produce conditional plots for each of these groups, but right now I want to summarize the results.
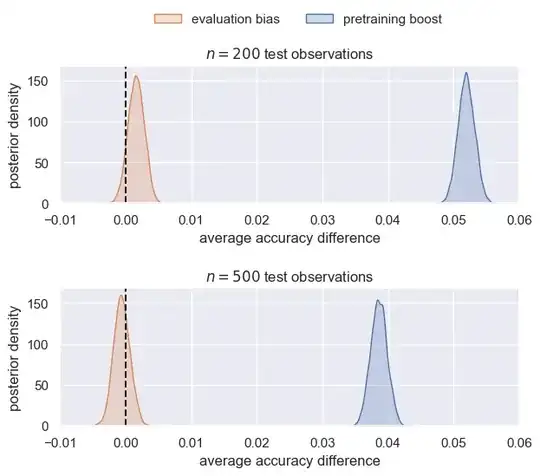
The pretraining boost is akin to $\text{acc}_{\text{extra}} - \text{acc}_{\text{base}}$. The evaluation bias is akin to $\text{acc}_{\text{test}} - \text{acc}_{\text{extra}}$.
There's strong evidence that pretraining helps. Despite this, there's a negligible amount of bias for $n=200$ and no bias for $n=500$.
Discussion
Training BERT and GPT-2 on unlabeled test set texts does not result in strong, optimistic estimates of out-of-sample classification performance.
TODO: can the results be explained by the ICM principle? Does the boost in pretraining or the bias from pretraining depend on whether the classification task is causal vs. anti-causal?
Meta-analysis
Above, I said:
An important source of variation in this experiment is the particular subsample/sample splits, so the experiment procedure was repeated on 50 random subsamples for each dataset for $n = 200$, 20 for $n = 500$.
Let's see if that's true. We'll run the analysis code on 500 slices of the $n=500$ dataset of accuracies such that exactly 1 subsample per classification task is included. The sliced version of the data is all you usually get from ML papers and benchmarks. What is the distribution of the posterior mean of $\beta$ for $n=500$?

The distribution of my conclusions from non-replicated data is pretty variant. There's a ~46% chance that I would've found a non-negligible positive or negative bias from pretraining on the test set.
The lesson learned is that this sort of technical replication / repeated subsampling can sometimes be important. (Collecting more classification tasks—the "biological" replicates in this experiment—is still vital of course. It just takes me more time to find and vet them.) Modern LM training procedures are highly unstable—we actually already saw that in the visualization for BERT accuracies. This instability is exacerbated when studying few-shot methods.
Instead of hiding behind random seeds and claims that conclusions are perfectly reproducible, it's almost always useful to expose the variance of a training/analysis procedure. A concrete recommendation for future few-shot learning studies/benchmarks is to include and score a model on multiple, independent subsamples for each task.
References
Devlin, Jacob, et al. "Bert: Pre-training of deep bidirectional transformers for language understanding." arXiv preprint arXiv:1810.04805 (2018).
Radford, Alec, et al. "Improving language understanding by generative pre-training." (2018).
Hastie, Trevor, et al. The elements of statistical learning: data mining, inference, and prediction. Vol. 2. New York: springer, 2009.
Moscovich, Amit, and Saharon Rosset. "On the cross-validation bias due to unsupervised preprocessing." Journal of the Royal Statistical Society Series B: Statistical Methodology 84.4 (2022): 1474-1502.


