I have some basic statistics foundations (Lean Six Sigma, Industrial Engineering in College), but I'm completely new to survival analysis, and relatively new to Data Science. So I'm looking to sanity-check my reasoning and whether my interpretation of the results is good.
Some context:
I've got a large survival dataset for employee turnover, numerous features (mostly psychometric), and I am looking to build a classifier to identify candidates that are likely to have a long tenure vs. those who would not.
Using Orange Data Mining. I continuized, standardized and imputed missing data before feeding it into a regularized cox regression. With fine-tuning of the regularization and feature selection, including a couple interactions, I got a C-index just under 0.7.
I then created a categorical target to distinguish between successful and non-successful candidates, using a cut-off survival time. I fed the cox risk score along with some of the original features into a logistic regression and managed to get an AUC of just over 0.7.
Finally, I tweaked the classification threshold using a calibration plot to balance precision, recall and proportion of selected candidates. The prediction using this threshold would be my model's end result, giving a "high risk" and a "low risk" binary classification.
I am currently looking into justice algorithms for pre-processing, to avoid any bias in the model disproportionately affecting certain groups.
The questions:
On model performance: I know that an r-value of 0.95 for linear regression is generally considered good in engineering. I have also heard that in psychology and sociology, the tends to be way lower due to the complexity of human behavior, but I am not informed on what a good rule-of-thumb value is for such scenarios.
I also don't know what a good standard is for C-Index and have based my evaluation of the model solely on its definition (0.5 = useless, 1 = perfect, 0.7 = decent??)What is a good target for this metrics?
On Kaplan-Meier Plots: First thing I did was to 70-30 split my data into training and validation sets. If I classify and graph both sets on the same graph, I get the following curves:
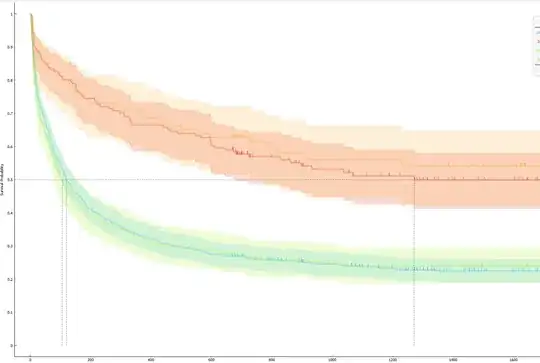 From which I interpret:
A) Since the "high risk" and "low risk" survival curves differ, and their confidence intervals do not overlap, I can be confident that the classification model accurately distinguishes between candidates likely to have a long tenure and those likely to have a short one.
B) Since the confidence intervals for the testing and validation sets overlap, I can be confident that this model can make useful predictions on unseen data, assuming.
Am I interpreting this correctly?

Thanks in advance for any advice,
And absolutely! Taking supply and demand into account at any given time, I can adjust the classification threshold for the recommendation.
This is the first time I work with survival analysis, and I have no coding experience at all, so thanks for the useful advice and pointing me towards those resources.
– Leonardo Segura Jan 04 '23 at 17:11I do agree on cox regression being way more informative than just a binary classification, and I would opt for using it to select the top n candidates from a pool given the hiring needs. Nonetheless, I was looking for something I could graph to convey the risk score representing high-er risk, and low-er risk, compared to our baseline.
Thanks again!
– Leonardo Segura Jan 04 '23 at 17:45calibrate()function in thermspackage can do that for you. – EdM Jan 05 '23 at 14:06