14

Let:

Standard deviation of random variable $A =\sigma_{1}=5$

Standard deviation of random variable $B=\sigma_{2}=4$

Then the variance of A+B is:

$Var(w_{1}A+w_{2}B)= w_{1}^{2}\sigma_{1}^{2}+w_{2}^{2}\sigma_{2}^{2} +2w_{1}w_{2}p_{1,2}\sigma_{1}\sigma_{2}$

Where:

$p_{1,2}$ is the correlation between the two random variables.

$w_{1}$ is the weight of random variable A

$w_{2}$ is the weight of random variable B

$w_{1}+w_{2}=1$

The figure below plots the variance of A and B as the weight of A changes from 0 to 1, for the correlations -1 (yellow),0 (blue) and 1 (red).

alt text

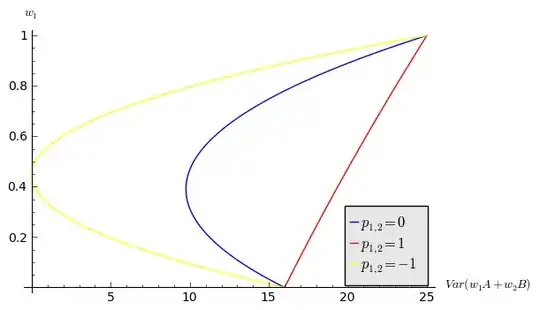
How did the formula result in a straight line (red) when the correlation is 1? As far as I can tell, when $p_{1,2}=1$, the formula simplifies to:

$Var(w_{1}A+w_{2}B)= w_{1}^{2}\sigma_{1}^{2}+w_{2}^{2}\sigma_{2}^{2} +2w_{1}w_{2}\sigma_{1}\sigma_{2}$

How can I express that in the form of $y=mx+c$?

Thank you.

Sara
  • 1,487

2 Answers2

14

Using $w_1 + w_2 = 1$, compute

$$\eqalign{ \text{Var}(w_1 A + w_2 B) &= \left( w_1 \sigma_1 + w_2 \sigma_2 \right)^2 \cr &= \left( w_1(\sigma_1 - \sigma_2) + \sigma_2 \right)^2 \text{.} } $$

This shows that when $\sigma_1 \ne \sigma_2$, the graph of the variance versus $w_1$ (shown sideways in the illustration) is a parabola centered at $\sigma_2 / (\sigma_2 - \sigma_1)$. No portion of any parabola is linear. With $\sigma_1 = 5$ and $\sigma_2 = 4$, the center is at $-5$: way below the graph at the scale in which it is drawn. Thus, you are looking at a small piece of a parabola, which will appear linear.

When $\sigma_1 = \sigma_2$, the variance is a linear function of $w_1$. In this case the plot would be a perfectly vertical line segment.

BTW, you knew this answer already, without calculation, because basic principles imply the plot of variance cannot be a line unless it is vertical. After all, there is no mathematical or statistical prohibition to restrict $w_1$ to lie between $0$ and $1$: any value of $w_1$ determines a new random variable (a linear combination of the random variables A and B) and therefore must have a non-negative value for its variance. Therefore all these curves (even when extended to the full vertical range of $w_1$ ) must lie to the right of the vertical axis. That precludes all lines except vertical ones.

Plot of the variance for $\rho = 1 - 2^{-k}, k = -1, 0, 1, \ldots, 10$:

alt text

whuber
  • 322,774
11

It isn't linear. The formula says it isn't linear. Trust your mathematical instinct!

It only appears linear in the graph because of the scale, with $\sigma_{1}=5$ and $\sigma_{2}=4$. Try it yourself: calculate the slopes at a few places and you will see that they differ. You can exaggerate the difference by picking $\sigma_{1}=37$, say.

Here is some R code:

a <- 5; b <- 4; p <- 1
f <- function(w) w^2*a^2 + (1-w)^2*b^2 + 2*w*(1-w)*p*a*b
curve(f, from = 0, to = 1)

If you would like to check some slopes:

(f(0.5) - f(0.4)) / 0.1
(f(0.8) - f(0.7)) / 0.1