I would start with periodograms before anything else. The simplest way to think of them is to imagine that you draw your data on a long transparent tape, then cut this tape into pieces one year long, then stack them on each other and look through. I'll show you a silly example in MATLAB.
On the left side, I'm showing the simulated raw data, where the top line is pure
noise and the bottom line has a signal buried in noise. Next, we construct the silly periodogram that I described above cutting the data into pieces 12 observations long. You can think of this as 12 monthly observations.
Two plots on the right show how this can reveal the seasonality in the data. The plot in the bottom shows the shape of the sine wave that I hid in the noise.

Obviously you can change the period length from 12 that I used to any other. For instance, below, I'm using the period 4 for the same kind of data, and you can see how the bottom and top plots on the right do not differ much. This would tell you that period length of 4 is not a good one for this data.

Or better, you can loop through all kinds of periods from very long to very short and see which one would produce you the clearest pattern. Below is the animated GIF file that shows how you loop through cycles from 0 to 20 observations long. You can see how at cycle length 12 the pattern is the most pronounced.

Often you have a good idea what seasonality to expect. It can be annual in many cases meaning literally seasons of the year. I suppose in biology the annual and daily cycles would be the most prevalent. There is really no reason to have weekly or monthly seasonality for nonhuman phenomena.
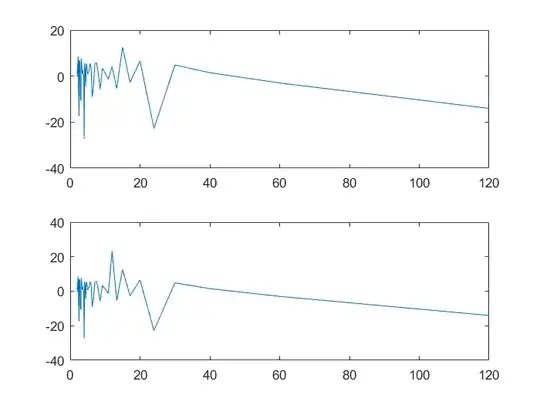
Now you can switch to fancier statistical methods, such as spectral densities. Here's the plot of the spectral density of the same data. You can see how the plot in the bottom has a peak at 12, indicating that it's likely to have the period 12 seasonality. You can still use a simple visual method that I described first to validate the findings of more advanced (but often less intuitive) methods.
Finally, I purposefully chose series without time trends. If you have the time trends then you need to remove them otherwise the periodograms will be messed up and ineffective.
Here's the MATLAB code. Thanks to this question. I figured out how to create animated GIFs in MATLAB, by stealing the code from here :)
n = 120;
x = randn(n,1);
r = x + 2*sin(2*pi/12*(1:n))';
subplot(2,2,1)
plot(x)
subplot(2,2,3)
plot(r)

x12 = reshape(x,4,n/4);
r12 = reshape(r,4,n/4);
subplot(2,2,2)
plot(x12)
subplot(2,2,4)
plot(r12)

[pxx,w] = periodogram(x,[],length(x),1);
figure
subplot(2,1,1)
plot(1./w,10*log10(pxx))

[pxx,w] = periodogram(r,[],length(x),1);
subplot(2,1,2)
plot(1./w,10*log10(pxx))

%%
figure
plot(r)
set(gca,'nextplot','replacechildren','visible','off')
f = getframe;
[im,map] = rgb2ind(f.cdata,256,'nodither');
im(1,1,1,20) = 0;
for k = 1:20
    np = (floor(length(r)/k)+1)*k;
    rpad = NaN(np,1);
    rpad(1:length(r))=r;
  rslice = reshape(rpad,k,length(rpad)/k);
    plot(rslice);
    legend({sprintf('k=%d',k)})
  f = getframe;
  im(:,:,1,k) = rgb2ind(f.cdata,map,'nodither');
end
imwrite(im,map,'per.gif','DelayTime',0.5,'LoopCount',inf) %g443800


