I'm familiar with what the 2nd moment (variance) indicates as well as what the 3rd moment (skewness) indicates. I know that on a histogram the 4th moment (kurtosis) indicates the "peeked-ness" of the data. My question asks what are the practical implications/interpretations of a kurtotic distribution. I'm asking this because I haven't found a case yet where I thought the 4th moment was theoretically interesting and interpretable. I understand that such interpretations/implications are likely to be dataset specific, so I am looking for descriptions of example datasets where the kurtosis of the distribution was theoretically interesting and interpretable.
Asked
Active
Viewed 4,983 times
4 Answers
9
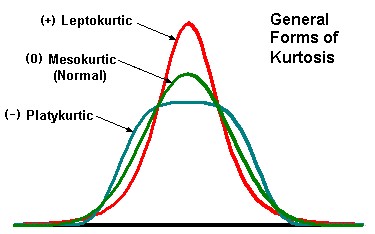
The kurtosis also indicates the "fat tailedness" of the distribution. A distribution with high kurtosis will have many extreme events (events far away from the center) and many "typical" events (events near the center). A distribution with low kurtosis will have events a moderate distance from the center. This picture may help: http://mvpprograms.com/help/images/KurtosisPict.jpg
John Salvatier
- 4,482
-
3Good answer, John. Note that kurtosis usually isn't worth looking at when a distribution is skewed: the skew already tells you there's going to be substantial kurtosis. Thus, good applications are with datasets known a priori to be (approximately) symmetric. Residuals often are this way: the kurtosis can be a quick numerical means to assess the shape of their distribution. An additional point is that the sampling variance of the standard deviation is a function of the kurtosis, so if you're estimating SDs or variances, you might want to glance at the kurtosis to assess the precision. – whuber Sep 06 '10 at 17:11
-
2@whuber: actually the range of possible values of skew and excess kurtosis allows distributions with some skew and zero excess kurtosis. – shabbychef Sep 08 '10 at 16:49
2
I seem to remember that the median has a smaller standard error than the mean when the samples are drawn from a leptokurtic distribution, but the mean has a smaller standard error when the distribution is platykurtic. I think I read this in one of Wilcox' books. Thus the kurtosis may dictate which kinds of locational tests one uses..
shabbychef
- 14,814
2
Haven't got an example of a dataset in mind with which to answer your question about the interpretation, but this answer to a related question indicates that a practical implication of kurtosis is biased variance estimates.
In considering the interpretive difference rationally, I think there's relevant information in the extreme example of a comparison between a normal distribution and a completely flat distribution (e.g., outcomes of rolled dice). This isn't a real dataset, but I'm sure everyone is familiar with both distributions and could easily create either or think of another example. Basically, the difference of a platykurtic distribution from a normal distribution is that the central tendency is weaker, and there is less of a difference between the probabilities of relatively common vs. extreme / rare events. Simply stated, the opposite is true of a leptokurtic distribution: some events are very common, and most of the rest are very rare, generally due to an unusually strong central tendency.
Also, you might want to consider this quote from Wikipedia (emphasis added):
One common measure of kurtosis, originating with Karl Pearson, is based on a scaled version of the fourth moment of the data or population, but it has been argued that this really measures heavy tails, and not peakedness...It is common practice to use an adjusted version of Pearson's kurtosis, the excess kurtosis, to provide a comparison of the shape of a given distribution to that of the normal distribution.
The above distinction between Pearson's kurtosis and excess kurtosis seems relevant to the comment from @whuber on the accepted answer.
Nick Stauner
- 12,342
- 5
- 52
- 110
0
There is the Kurtosis risk which isn't explained fantastically well at that link.
In general, measures of normality (or deviation therefrom) are crucial if you are using analyses that assume normality. For example, the standard workhorse Pearson-r correlation coefficient is severely sensitive to outliers and becomes essentially invalid as excess kurtosis deviates from 0.
The K² test is often used to check a distribution for normality and incorporates the sample kurtosis as a factor.
msw
- 131
-
"Crucial" is a category; severity is a continuous dimension, as is kurtosis (or skew, for that matter). Consider this related question. Note also that skew may be less problematic than kurtosis for issues of variance such as correlations. Last, for the sake of distinguishing between kurtosis and skew, there is a specific test of kurtosis that ignores skew: the Anscombe-Glynn test. – Nick Stauner Nov 27 '13 at 10:00