I am attempting to model the fluorescent signal emitted by a fluorescent calcium indicator (lights up when there is calcium influx into a cell). According to [1], the following formula works as a workable approximation, under certain conditions:
$\Delta F/F = A(1 − e^{−t/\tau_{on}})e^{−t/\tau_{off}}$
$\Delta F/F$ is the change in fluorescence, $t$ is the time since the onset of the signal waveform, $\tau_{on}$ and $\tau_{off}$ represent the rise and decay times respectively; $A$ scales the amplitude of the trace.
My issue is with the two $\tau$s. I was under the impression I could simply plug in appropriate values (e.g. 10 and 1000 ms) for the two $tau$s and I would get a waveform with rise-to-peak and decay-to-baseline times equal to the values of my choice (i.e. also 10 and 1000). This however, doesn't appear to be the case. The wave's rise and decay times each depend on both $\tau$s, such that changing $\tau_{on}$ also affects the decay and vice versa.
My question is: Is it possible to specify exact rise-to-peak, and decay-to-baseline times in the formula above? And if so, how?
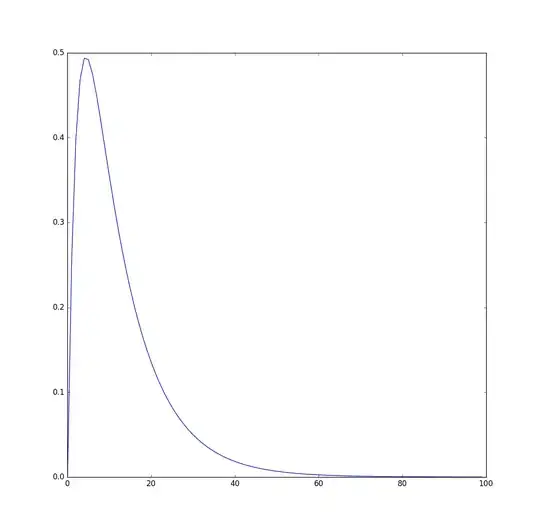
Here's an example I generated with $\tau_{on} = 3$ and $\tau_{off} = 10$ in python. The peak is at 3, and the curve closes in on the baseline around 70, definitely not around 13, which is what I am aiming for.
[1] Lütcke, H., Gerhard, F., Zenke, F., Gerstner, W., & Helmchen, F. (2013). Inference of neuronal network spike dynamics and topology from calcium imaging data. Frontiers in Neural Circuits, 7, 201. http://doi.org/10.3389/fncir.2013.00201