I have a dataset depicting weekly revenue over time for a computer company. The plot for the data looks like this:

I decomposed the data into its additive components using the decompose function in R and plotted the various components:
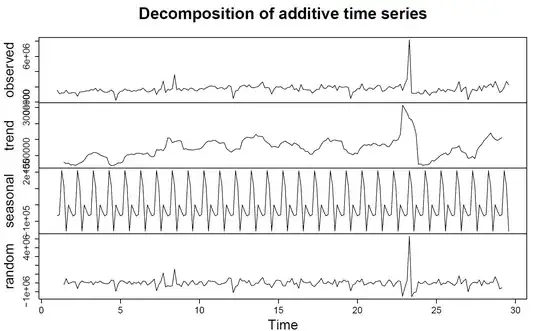
Next I tried removing the seasonal component using the following code:
> RevenueDec <- decompose(Revenue)
> RevenueSeasonallyAdjusted <- Revenue  - RevenueDec$seasonal
However, I still get a seasonal component when I decompose 'RevenueSeasonallyAdjusted':

The y-axis has very small values but the seasonality exists nonetheless.
Could you help me out here.
EDIT: In the next step I tried using the auto.arima function on my seasonally adjusted data to get a forecast and got a plot like this:

Is this the correct approach to use, or should I try something different?
decomposeRevenueSeasonallyAdjusted again? You already removed the seasonal part, so you should have all you need. If you are asking why you are still getting the seaonal part, it because it is calculated by default in thedecomposefunction. Typedecomposein the console and you will see that it is always calculated either byseason <- x - trend(for an addative decomposition) orseason <- x/trend(for multiplicative decomposition) – David Arenburg Jun 30 '14 at 13:20auto.arimafrom theforecastpackage. See here or here on how to add seaosonal part to anauto.arima– David Arenburg Jun 30 '14 at 13:35auto.arimaform theforecastpackage should be a good tool. But you have to provide maximum information, which means seasonal parts, explaining variables and etc. – David Arenburg Jun 30 '14 at 14:09