This is not a question that can resolved using statistics or stochastics. First off, it obviously depends on the player of each team, of the conditions on the field, etc.
Let's make an easy scenario: We have two duplicates of exactly the same team playing against each other, with sides of the field determined by random choice. In this case, it would follow by symmetry that each team is equally likely to win.
These assumptions do not suffice to determine the likelihood of a draw - there are psychological factors at play. For example, depending on the team they might become especially motivated or demotivated if they are behind.
Sure, as @rbm could you might model the number of goals as Poisson-Distributed, but this would assume that the performance of the teams would be unaffected by the current score and the time remaining. That wouldn't be soccer anymore. If you would go that route, it would depend on the lambda parameter (which roughly described the rate of goals per team). Depending on lambda a tie become more or less likely. My intuition is that the higher lambda is the less likely a win becomes - if both team tends to score many goals it becomes unlikely that they end up at the exact same number. If both tend to not score any goal at all it is likely the game will end 0:0.
I then tested my intuition with some simulation code in R:
lambda <- seq(0, 30, by = 0.1)
draws <- rep(0, length(lambda))


for (i in 1:length(lambda)) {
lamb <- lambda[i]
team1 <- rpois(1e6, lamb)
team2 <- rpois(1e6, lamb)
draws <- team1 == team2
draw.likelihood[i] <- sum(draws)/length(draws)
}

plot(draw.likelihood ~ lambda, type = "l", lwd = 2)
grid()
You can interpret lambda as average goals per side per game. The results look like this and matches my intuition:
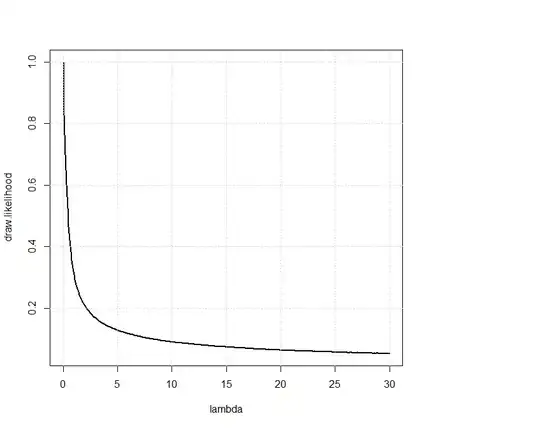
Since even good teams seldom score more than three goals per game you get a substantial draw rate. At least it matches real observations so far. For reference for lambda = 0, 1, 2, 3 the draw rates are 100%, 31%, 21% and 17% respectively.