0

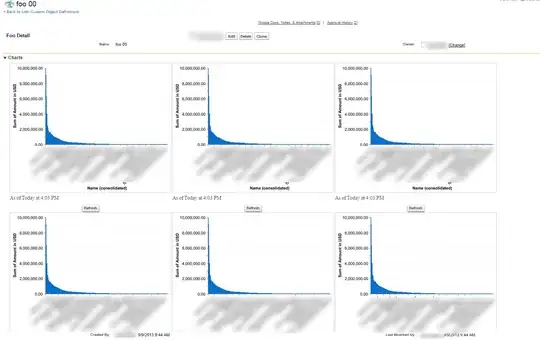
I need to add six charts to a page layout from a force.com report. All the reports are summarized with a chart. They show in the layout but I need to align them as 3 charts horizontally and 2 rows of charts vertically.

Can't seem to align the charts this way using the page layout. How do I do this in visualforce ? Is there a free app we can use to assist with this ? I've seen people using iFrames but now that is not supported due to clickJacking. Is the new apex component tag the best way to do this now ? I prefer to not code any apex classes to do something like this and we already have the reports and dashboard built in force.com.

Any examples / ideas ??

When I preview this visualforce page I see an empty box with" To view the report chart, you need both the Run Reports permission and access to the report's folder" as the error message.

This is working now. Had the ID ref of a dashboard which doesn't work with this. Only reports.

<apex:page standardController="Audit__c" showHeader="true" >

<apex:panelGrid columns="3" id="theGrid">
<analytics:reportChart reportId="00OJ0000000e1R1" size="tiny" showRefreshButton="true" />
<analytics:reportChart reportId="00OJ0000000e2FB" size="tiny" showRefreshButton="true" />
<analytics:reportChart reportId="00OJ0000000e0o4" size="tiny" showRefreshButton="true" /> 
</apex:panelGrid>

</apex:page>
rickmac
  • 753
  • 1
  • 10
  • 32
  • Look into using apex:chart components. https://www.salesforce.com/us/developer/docs/pages/Content/pages_compref_chart.htm – Adrian Larson Jan 22 '15 at 20:34
  • I want to stick with the basics on this using apex component analytics:reportChart and added the code and error I'm getting. Just trying to use the id of a simple report. Hopefully this works. – rickmac Jan 22 '15 at 22:53
  • 1
    You should post more of your page markup. This seems like a CSS issue. – Adrian Larson Jan 22 '15 at 22:58
  • I updated the code. How do I find the 18 character ID for the report ? I would like to run this url to get the API name of a field to filter on. But it fails with the 15 character report ID. /services/data/v29.0/analytics/reports/00OJ0000000e1R1/describe – rickmac Jan 23 '15 at 16:29
  • http://www.sfdcpoint.com/salesforce/salesforce-id-15-digit-18-digit-conversion/ – Adrian Larson Jan 23 '15 at 17:03
  • Talked to support about this. Used the salesforce dataloader to export the Report objects which produce all the 18 char ID's . – rickmac Jan 23 '15 at 20:04
  • Another interesting link to convert from 15 - 18 characters: http://salesforce.stackexchange.com/questions/27686/how-can-i-convert-a-15-char-id-value-into-an-18-char-id-value – rickmac Jan 23 '15 at 20:05
  • An online converter tool for the same: http://www.adminbooster.com/tool/15to18 – rickmac Jan 23 '15 at 20:05
  • Unless they have an API that's not going to help much in this use case. @rickmac – Adrian Larson Jan 23 '15 at 20:24

1 Answers1

0

I tried the following and it worked fine:

VF page:

<apex:page standardController="Foo__c"> 
 <apex:panelGrid columns="3">
   <analytics:reportChart reportId="00Od0000004O4PB" />
   <analytics:reportChart reportId="00Od0000004O4PB" />
   <analytics:reportChart reportId="00Od0000004O4PB" />
   <analytics:reportChart reportId="00Od0000004O4PB" />
   <analytics:reportChart reportId="00Od0000004O4PB" />
   <analytics:reportChart reportId="00Od0000004O4PB" />
</apex:panelGrid>
</apex:page>

That was embedded in the standard page layout for Foo__c in a new section, 1 column

Here is a screenshot

enter image description here

cropredy
  • 71,240
  • 8
  • 120
  • 270
  • How can we remove the subtitle "As of .... Today at time..." on these charts ? – rickmac Mar 03 '15 at 13:15
  • @rickmac - I'm going to guess you'll need jQuery to find the DOM element and then set css attribute as display:none - I didn't see any VF component attribute to suppress this – cropredy Mar 03 '15 at 20:21
  • Yes, this is what worked: – rickmac Mar 04 '15 at 22:36