Here is a way how you would go back to the caller. The following is a small C++ crackme for demonstration
#include<stdio.h>
#include<string.h>
#include<conio.h>
int main()
{
    char code[50];
    char valid[]="12345";
    printf("Enter your password : \n");
    gets(code);
    if(!strcmp(code,valid))
        printf("That's it!!!\n");
    else
        printf("Try again!!!\n");
    getch();

    return 0;
}
Step 1
Now as usual you load the app in OllyDBG. Now assume that we do not know anything the inner logic of the crackme. So lets put a breakpoint on the functions which prints on the console. So the best bet is to search for all intermodular calls.
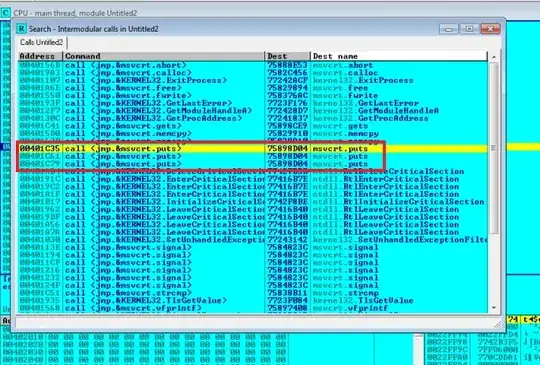
Step 2
So you see it calls puts .This function is used to display a string on the console and is called from 3 places. So lets place a breakpoint on the function itself so that we can know from where it is called.
Now the function is defined at VA 0x75898D04 . So put a breakpoint over there.
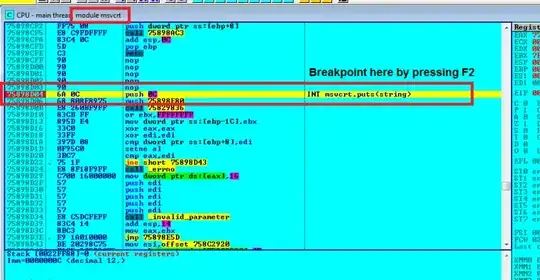
Step 3
Now run the app by pressing F9 till breakpoint is hit.
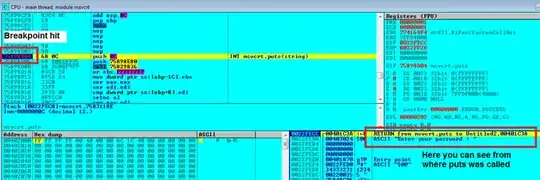
Now look at the stack at the bottom right it shows the place from where puts would return after executing as well as the parameters passed to this function.
Since this parameter passed is the string asking for password we can skip it until we get to the badboy message string. So continue pressing F9 until you get to the point where the parameter passed is the badboy message. (The console meanwhile asks for the password and write something there)
So we run till here.
Step 4
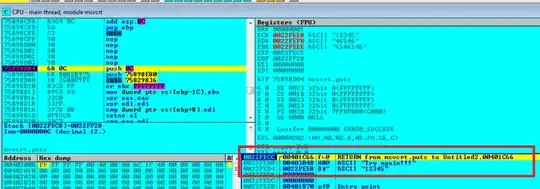
puts would return to VA 0x401C66 and the parameter passed is the badboy message.
So lets go to 0x401C66.
Press Ctrl+G in the CPU window to go there.
You can also press Enter directly on the return address shown on the stack.
So we land here.
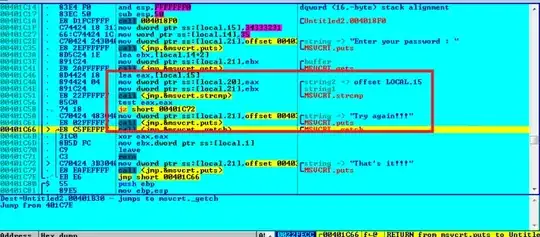
Step 5
Just above the puts call there is a strcmp call checking our entered serial with a hardcoded value. If you explore a little you can see that the hardcoded value is 12345
(You may set a breakpoint on the strcmp call and restart the target to see what is being compared to whom)
So that's the serial which would skip the badboy message and land us to the goodboy message.
I am not suggesting the Ctrl+F9 method because you may sometimes encounter function which never returns. Such functions are specifically coded to obfuscate and thwart static and dynamic analysis. However in other cases Ctrl+F9 method is pretty good.
printf()breakpoint. – Jason Geffner Dec 27 '13 at 22:55http://i.imgur.com/r7M7xCN.png This screenshot shows where code skips after i hit f9.
– Igor Dec 27 '13 at 23:00printf()function; it's on the call to theprintf()function. And don't bother usingF9in this context as it will just run your program until it terminates. – Jason Geffner Dec 27 '13 at 23:34printf(). – Jason Geffner Dec 28 '13 at 01:31