S&P seems to publish the earnings at https://www.spglobal.com/spdji/en/documents/additional-material/sp-500-eps-est.xlsx (though I do not regularly use this source and so I don't know how stable that source is). There is a link under https://www.spglobal.com/spdji/en/indices/equity/sp-500/#overview (see "Additional Info"). [Note that you can get price data from the same site, by using the "Export" option in the performance chart.]
Robert Shiller's earnings data, with the last two quarters marked (the non-quarter months are interpolated):

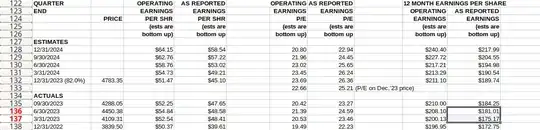
S&P's data with the last quarterly numbers marked:
June differs slightly, but perhaps not all companies have had reported when Professor Shiller had last updated the file.
For the price level, at least in the past, I think he used an average price for the month. Following the comment of @nbbo2 , here is a quick check (in R), comparing Robert Shiller's data with Yahoo:
library("NMOF")
library("tseries")
library("zoo")
Fetch data from Robert Shiller's website:
shiller <- Shiller(tempdir())
shiller.date <- format(shiller[["Date"]], "%Y-%m")
shiller.price <- shiller[["Price"]]
Fetch S&P 500 data from Yahoo:
yhoo <- get.hist.quote("^SPX", quote = "Close")
yhoo <- tapply(coredata(yhoo), FUN = mean,
               format(index(yhoo), "%Y-%m"))
yhoo <- yhoo[names(yhoo) %in% shiller.date]
Compare data
keep <- shiller.date %in% names(yhoo)
data.frame(Shiller = shiller.price[keep],
           Yahoo = yhoo,
           Difference = round(shiller.price[keep] - yhoo, 2))
Shiller     Yahoo Difference
1991-01  325.490  325.4855       0.00
1991-02  362.260  362.2632       0.00
1991-03  372.280  372.2790       0.00
1991-04  379.680  379.6786       0.00
1991-05  377.990  377.9923       0.00
....
1997-07  925.290  925.2945       0.00
1997-08  927.240  927.7357      -0.50
1997-09  937.020  937.0243       0.00
....
2002-03 1153.790 1153.7910       0.00
2002-04 1111.930 1112.0345      -0.10
2002-05 1079.250 1079.2673      -0.02
2002-06 1014.020 1014.0480      -0.03
2002-07  903.590  903.5855       0.00
....
2022-11 3917.489 3917.4886       0.00
2022-12 3912.381 3912.3810       0.00
2023-01 3960.657 3960.6565       0.00
2023-02 4079.685 4079.6847       0.00
2023-03 3968.559 3968.5591       0.00
2023-04 4121.467 4121.4674       0.00
2023-05 4146.173 4146.1732       0.00
2023-06 4345.373 4345.3728       0.00
2023-07 4508.076 4508.0755       0.00
2023-08 4457.359 4457.3587       0.00
2023-09 4515.770 4409.0950     106.68
I have suppressed most of the output -- for most months, the difference between the mean S&P and Shiller's price series is zero.
summary(round(shiller.price[keep] - yhoo, 2))
##    Min. 1st Qu.  Median    Mean 3rd Qu.    Max.
##  -6.530   0.000   0.000   0.258   0.000 106.680
The single large deviation of 106 happens in September 2023, because the file had not been updated.

