I can think of a few simple and quick techniques for timing the market over the long term, and they can be used individually or in combination with each other. There are also some additional techniques to give early warning of possible turns in the market.
The first is using a Moving Average (MA) as an indication of when to sell. Simply if the price closes below the MA it is time to sell. Obviously if the period you are looking at is long term you would probably use a weekly or even monthly chart and use a relatively large period MA such as a 50 week or 100 week moving average. The longer the period the more the MA will lag behind the price but the less false signals and whipsawing there will be. As we are looking long term (5 years +) I would use a weekly chart with a 100 week Exponential MA.
The second technique is using a Rate Of Change (ROC) Indicator, which is a momentum indicator. The idea for timing the markets in the long term is to buy when the indicator crosses above the zero line and sell when it crosses below the zero line. For long term investing I would use a 13 week EMA of the 52 week ROC (the EMA smooths out the ROC indicator to reduce the chance of false signals).
The beauty of these two indicators is they can be used effectively together. Below are examples of using these two indicators in combination on the S&P500 and the Australian S&P ASX200 over the past 20 years.
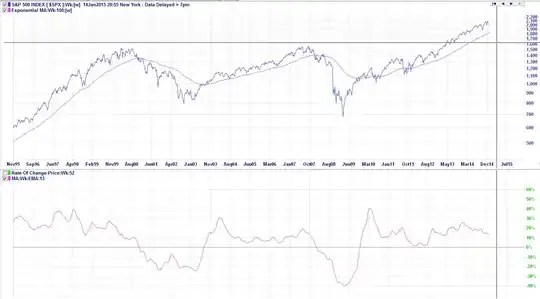 S&P500 1995 to 2015
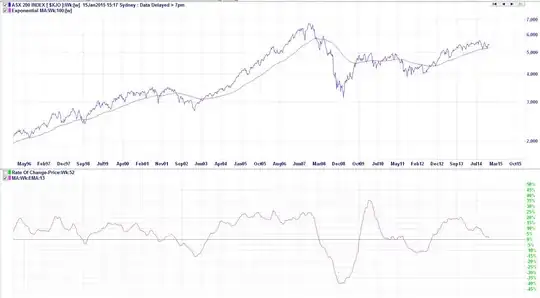 ASX200 1995 to 2015
If I was investing in an ETF tracking one of these indexes I would use these two indicators together by using the MA as an early warning system and maybe tighten any stop losses I have so that if the market takes a sudden turn downward the majority of my profits would be protected. I would then use the ROC Indicator to sell out completely out of the ETF when it crosses below zero or to buy back in when the ROC moves back above zero.
As you can see in both charts the two indicators would have kept you out of the market during the worst of the downfalls in 2000 and 2008 for the S&P500 and 2008 for the ASX200. If there is a false signal that gets you out of the market you can quite easily get back in if the indicator goes back above zero.
Using these indicators you would have gotten into the market 3 times and out of it twice for the S&P500 over a 20 year period. For the ASX200 you would have gone in 6 times and out 5 times, also over a 20 year period.
For individual shares I would use the ROC indicator over the main index the shares belong to, to give an indication of when to be buying individual stocks and when to tighten stop losses and stay on the sidelines. My philosophy is to buy rising stocks in a rising market and sell falling stocks in a falling market.
So if the ROC indicator is above zero I would be looking to buy fundamentally healthy stocks that are up-trending and place a 20% trailing stop loss on them. If I get stopped out of one stock then I would look to replace it with another as long as the ROC is still above zero. If the ROC indicator crosses below zero I would tighten my trailing stop losses to 5% and not buy any new stocks once I get stopped out.
Some additional indicators I would use for individual stock would be trend lines and using the MACD as a momentum indicator. These two indicators can give you further early warning that the stock may be about to reverse from its current trend, so you can tighten your stop loss even if the ROC is still above zero.
Here is an example chart to explain:
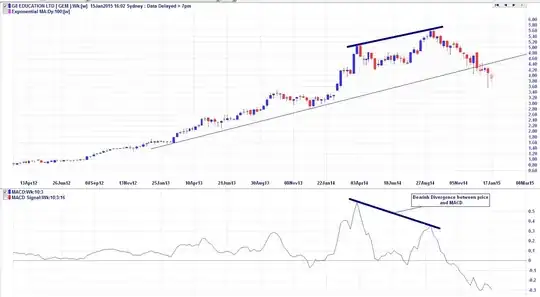 GEM.AX 3 Year Weekly Chart
Basically if the price closes below the trend line it may be time to close out the position or at the very least tighten up your trailing stop loss to 5%. If the price breaks below an established uptrend line it may well be the end of the uptrend. The definition of an uptrend is higher highs and higher lows. As GEM has broken below the uptrend line and has maid a lower low, all that is needed to confirm the uptrend is over is a lower high.
But months before the price broke below the uptrend line, the MACD momentum indicator was showing bearish divergence between it and the price. In early September 2014 the price made a higher high but the MACD made a lower high. This is called a bearish divergence and is an early warning signal that the momentum in the uptrend is weakening and the trend could be reversing soon. Notice I said could and not would. In this situation I would reduce my trailing stop to 10% and keep a watchful eye on this stock over the coming months.
There are many other indicators that could be used as signals or as early warnings, but I thought I would talk about some of my favourites and ones I use on a daily and weekly basis. If you were to employ any of these techniques into your investing or trading it may take a little while to learn about them properly and to implement them into your trading plan, but once you have done that you would only need to spend 1 to 2 hours per week managing your portfolio if trading long-term or about 1 hour per nigh (after market close) if trading more medium term.