8

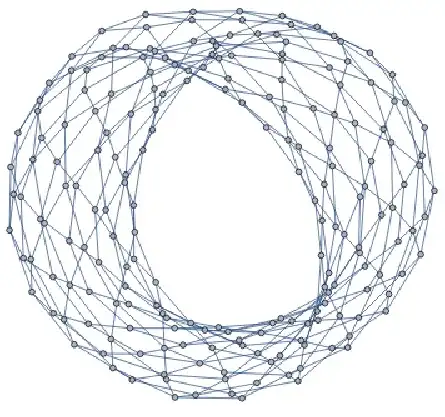
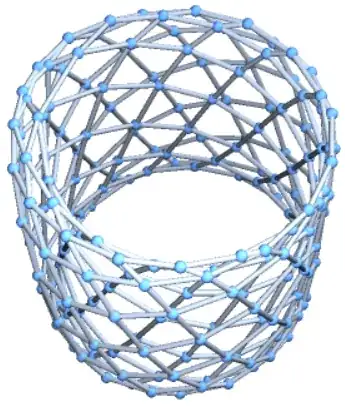
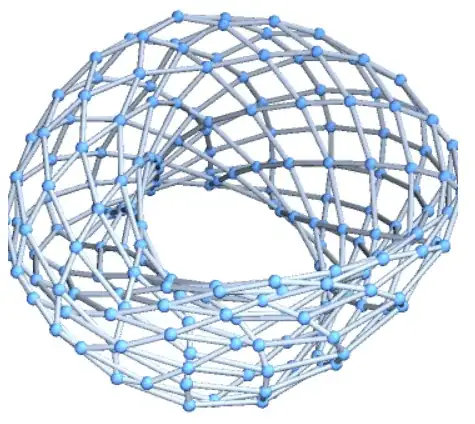
Very recently, in arXiv:2008.01153, Steinerberger has associated to any sequence $(x_n)_{n\in\mathbb{N}}$ of distinct real numbers a 4-regular graph.

In the case irrational multiples, like $x_n=n\sqrt{2} \pmod{1}$, the plots in $\mathbb{R}^2$ seem to show the projection of a certain genus-g surface (see page 2 of the preprint). [edit:06-sept-2020: I had written that these were plots in $\mathbb{R}^3$, which is actually not the case, apologies.]

is that indeed the case, i.e. does a limit shape as $n$ goes to infinity exist ? What type of literature (e.g. keywords, theorems) one should be looking at to establish it ?

  • Isn't the paper saying that these surfaces are generated by the "van der Corpus sequence" rather than anything with $\sqrt 2$? – M. Winter Aug 08 '20 at 09:09
  • For the plots shown, yes, but it is written that it also happens for these other sequences. I am intertested by any sequence producing a limit space with that construction. – Thomas Sauvaget Aug 08 '20 at 09:56
  • 2
    @ThomasSauvaget I think Béart answer points to the right field. More specifically, I think the area where graph theory intersects with differential topology is relevant for you. Not directly related, but to give you an idea of this area and the machinery/techniques, look at the references in this post https://mathoverflow.net/q/368129/161328 – GraphX Aug 08 '20 at 10:44
  • 2
    How do you embed the graph in $\mathbb{R}^3$? – Antoine Labelle Sep 04 '20 at 20:19
  • 1
    @AntoineLabelle : thanks for the question, I now realise that these are actually plots of the graph in the plane (I'll edit the question). It still suggests that this is the projection of some higher dimensional manifold. – Thomas Sauvaget Sep 06 '20 at 06:31
  • @ThomasSauvaget I still don't get how you canonically embed the graph in the plane. – Antoine Labelle Sep 06 '20 at 15:07

2 Answers2

5

The Steinerberger article seems to be aimed at tests about randomness. The question you are raising, which is given as an initial observation in this article, is a topic in topological graph theory.

The following link should give you helpful references for your question: Reference for topological graph theory (research / problem-oriented) .

Béart
  • 29
  • 11
  • Yes, I actually work in stats and was curious about the randomness test, but the geometric plot is hard to ignore. Thanks for the link. – Thomas Sauvaget Aug 08 '20 at 10:59
4

Here is a short Mathematica script that computes the graph and plots it with some standard function

f[n_] := Mod[n * Sqrt[2]//N, 1];

n = 200; seq = f /@ Range[1,n]; map = PositionIndex[seq]; sort = map[#][[1]] & /@ (Sort@seq);

edge1 = Partition[Range[1,n], 2, 1] ~ Join ~ {{n,1}}; edge2 = Partition[sort, 2, 1] ~ Join ~ {{sort[[-1]], sort[[1]]}}; G = Graph[Join[edge1, edge2]]

GraphPlot3D[G, GraphLayout->"SpectralEmbedding"]
GraphPlot3D[G, GraphLayout->"SpringElectricalEmbedding"]

It seems to resemble some kind of genus 1 surface.


But seems to have nothing to do with $\sqrt2$. If I replace $\sqrt 2$ with $\pi$, the result still looks like a torus:

Apparently, all we need is that the number is irrational.

M. Winter
  • 12,574