I remembered GeoGebra doing this several years ago, but I thought that functionality died with the last "classic" version of the program. But, I see it can still be done via the web app.
- Go to the 3D GeoGebra web app
- In the input bar, type in some vectors. To type a vector, the notation is: Vector((starting point), (ending point))
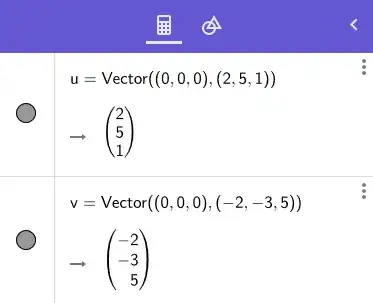
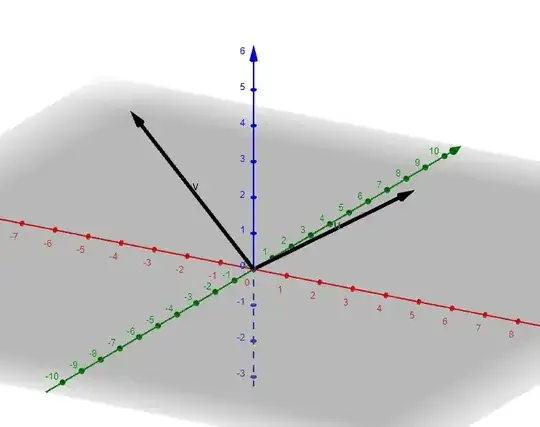
- You should see a typical 3D rendering of the vectors.
- Now right-click somewhere on the graphing window, and you should see a pop-up window. Select the last option for Settings:
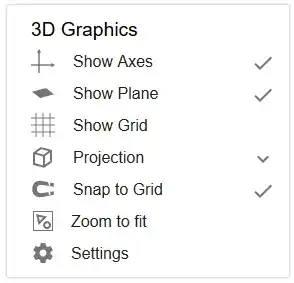
- You should now get another pop-up/side-scroll window. Select the last tab for Projection, and click the button that looks like a pair of glasses.

- Now the image should render as an anaglyph for red/cyan glasses.

- This works with other functions as well. For example, $z = \frac{6xy}{e^{0.2x^2 + 0.2y^2}}$. [I don't have a pair of 3D glasses, so I cannot tell you how well this works in practice.

Edit
I forgot to mention the "animation" part of your question. You can rotate the image by clicking and dragging the image, but getting the image to automatically rotate around, say, the z-axis, requires a line or two of code and doesn't seem to run as smoothly as just clicking and dragging.


