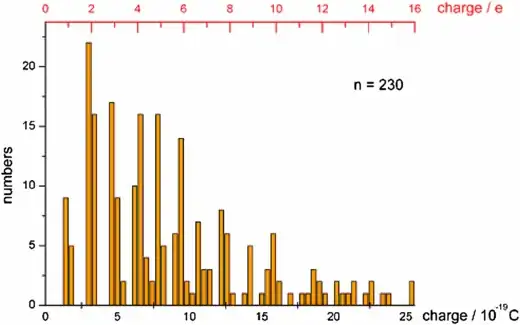
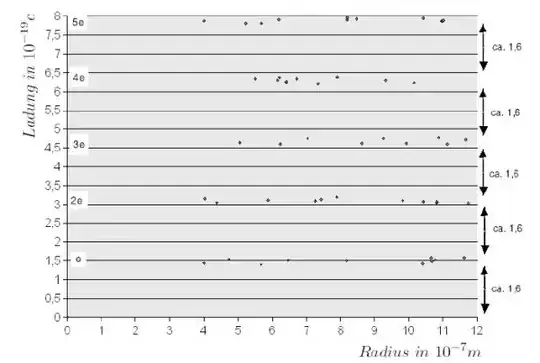
There are two typical visualizations for one of the results of the Millikan oil-drop experiment to illustrate that only integer multiples of some elementary charge occur in nature.
The first one is as a histogram like this one (source):
The second just a simple scatter plot like this (source):
I just skimmed over some of Millikan's original papers but didn't find any visualization like the above ones. So did Millikan actually use such kind of plots? In which paper did those typical textbook diagrams of the Millikan experiment appear for the first time?