First at all, I want to say that I am geocoding enthusiastic but have no formal background on GIS. I'll do my best to use the right wording and make myself clear what I am striving for.
Also the only tool I have available for this task is Python. This is a project I am working on in my own time but hopefully will kick off at work if I manage to produce something meaningful.
I have downloaded the Code-Point® Open from the Ordnance Survey that contains postcode units (~1.7M) for Great Britain and converted eastings & northings to Lat & Lon in WGS84.
From postcodes I've also created sector, district & area levels and a custom level that regroups areas into North, South, East & West. So my final product is a csv file that contains the levels mentioned above plus Lat & Lon. The granularity of my file is postcode level
What I want to do is to create a layer for each level and then use them later on TileMill or google map in order to create a thematic map where each patch/polygon will change color based on specific events.
In my view, what I need to do is to group these coordinates based on each level, create a collection of polygons and then create or export them as a layer (or shapefile??).
I've been looking to Shapely but I am not sure whether is the right tool for it and online examples don't make much of a sense to me due to my lack of knowledge on this matter.
Can anyone please point me out on the right direction or provide me with a small piece of code as example?
Any advice will be highly appreciated!
[EDIT 1]
I created my layer as per the below instructions but can't see my area polygons yet.

[EDIT 2]
I've all over again 3 times and still don't get to see the polygons - I've checked my csv file and the area column has values as expected (120 areas). Here it is another screenshot with layer metadata.

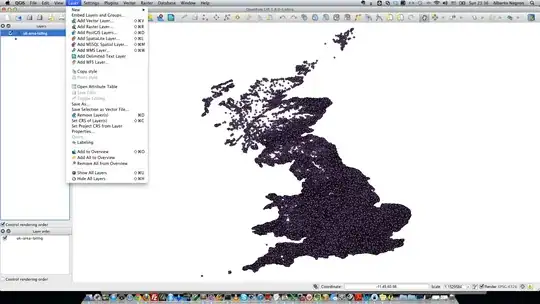
And here it is a screenshot with all layers apart from original - it shows nothing.

[Edit 3]
Query option disabled.
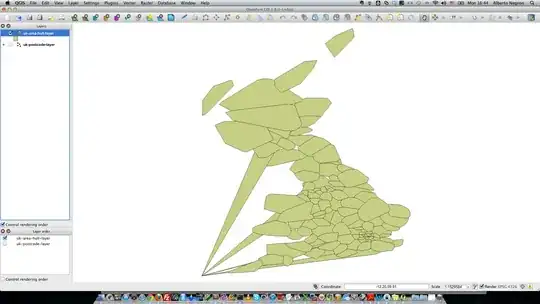
[Edit 4] After 4hrs processing I get to see my polygons:
In summary these are the steps:
- Import csv file
- Export file as shapefile
- Re-import shapefile (could be new on a new project)
- Apply the query logic
- Apply the Convex Hull and wait.
- that's pretty much