I would like to use R and leaflet to draw a circle (a real circle on the surface of the earth) on a mercator projection.
In the following code, I have the center of the circle (with lng=0 and lat=60), and I would like to have a parametric equation to draw the circle. I started with the equation below, and I can draw it on a leaflet map:
centre=c(0,60)
t=seq(0,2*pi,0.005)
r=9
xx=cos(t)*r+centre[1]
yy=sin(t)*r+centre[2]
Then I can draw the form on a leaflet map:
leaflet() %>%
  addTiles() %>%
  addPolygons(
    lng=xx, lat=yy,fillColor = "transparent"
  )%>%
  addCircleMarkers(lng=centre[1], lat=centre[2],radius=1,color="red")
The code above gives this kind of formes on the earth: http://www.mylovedone.com/image/solstice/sum12/tissotFig3b.jpg
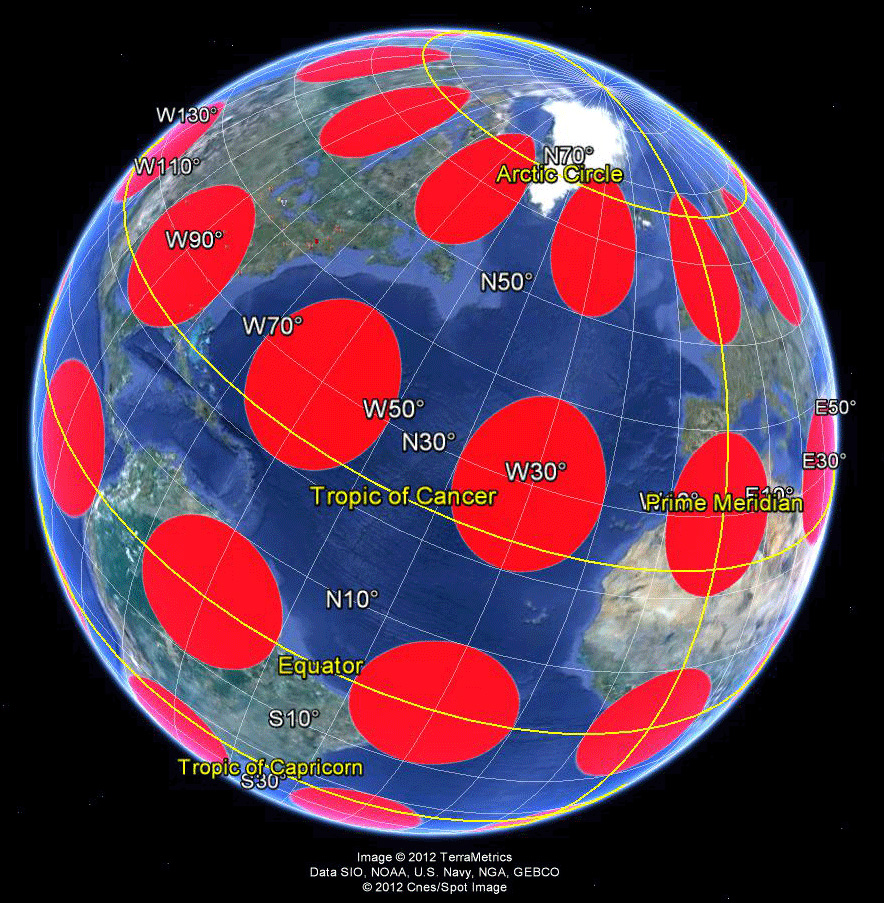
I did't make the image, but I think they are the same. And what I want to draw is this: https://i.stack.imgur.com/IiN3c.jpg
How should I modify the equation of the circle so that I can obtain a real circle.
Is this a Tissot's indicatrix? It seems that a Tissot's indicatrix is to render a circle on the sphere on a map. However, the Tissot's indicatrix on a mercator projection is a circle! I can't understand how it is possible. Since if you draw a circle on the north pole, there is no way it is a circle on mercator projection.
EDIT: I found this web site http://www.movable-type.co.uk/scripts/latlong.html it shows the equation of destinations, givens one point, the direction and the distance. So it is then possible to draw the cercle!