Let's say I have 1 band raster images with Gray Color Interpretation and I want to change their color based on their data values. Data values -1, will be Blue, -0.5 will be Light Blue, 0 will be Yellow, 0.5 will be Orange and 1 will be Red. If the data values are <-3000, I want to have that colored Black and if the data values are >3.402, that should be colored White . Will that be possible in gdal? And process that in batch?
Asked
Active
Viewed 1.8k times
18
-
2There is an answer for that on GIS.SE: http://gis.stackexchange.com/questions/104196/how-to-add-a-color-table-to-a-one-band-tiff-using-gdal more information about color tables here: http://trac.osgeo.org/gdal/wiki/FAQRaster#Howtocreateormodifyanimagecolortable – jzol Jan 14 '15 at 08:55
-
What does c1, c2, c3, c4, ..... cN means in vrt? The easiest non-scripting way to create or modify a color palette is to translate your file to VRT (XML) format, and edit the color table in the XML file. - Does this mean that you have to modify the files one by one? What if there are many files that I need to change the color from one directory? Will these be possible also? – lovelyvm Feb 02 '15 at 05:34
2 Answers
22
c1 to c4 in the vrt file are the RGBA values you see in a 4-channel RGBA tif file. Every row corresponds to an integer palette value in the source file.
EDIT
gdaldem seems to be the right tool for your task:
- Take a raster of your choice (like SRTM as an example)
- Create the following text file named
col.txt:
0 black
100 blue
200 yellow
300 orange
400 red
500 white
- On command line, run
gdaldem color-relief N51E007.hgt col.txt out.tif
and the result will look like this:
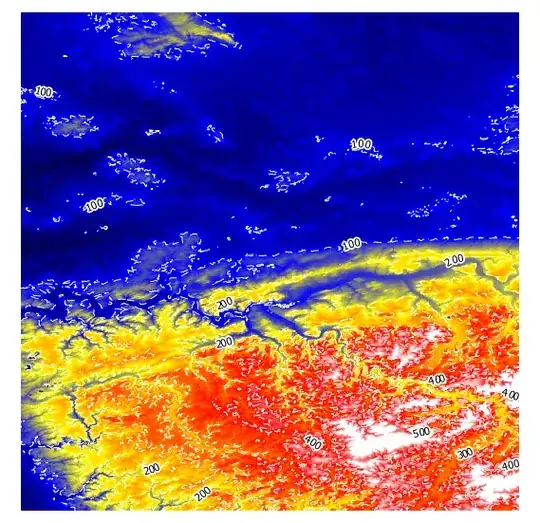
I have added white dashed contour lines to show that the colours get interpolated.
Instead of colour names, you can use RGB values as well, see http://www.gdal.org/gdaldem.html#gdaldem_color_relief for details:
The supported list is : white, black, red, green, blue, yellow, magenta, cyan, aqua, grey/gray, orange, brown, purple/violet and indigo
You can create a vrt file as output too and look into that on how the interpolating is done with <LUT> keys:
gdaldem color-relief -of VRT N51E007.hgt col.txt out.vrt
...
  <VRTRasterBand dataType="Byte" band="1">
    <ColorInterp>Red</ColorInterp>
    <ComplexSource>
      <SourceFilename relativeToVRT="1">N51E007.hgt</SourceFilename>
      <SourceBand>1</SourceBand>
      <SourceProperties RasterXSize="1201" RasterYSize="1201" DataType="Int16" BlockXSize="1201" BlockYSize="1"/>
      <SrcRect xOff="0" yOff="0" xSize="1201" ySize="1201"/>
      <DstRect xOff="0" yOff="0" xSize="1201" ySize="1201"/>
      <LUT>0:0,100:0,200:0,300:255,400:255,500:255</LUT>
    </ComplexSource>
  </VRTRasterBand>
update
To apply different transparencies, I got around with this batch:
gdaldem color-relief -of GTiff N51E006.hgt color.txt output6.tif -alpha
gdaldem color-relief -of GTiff N51E007.hgt color.txt output7.tif -alpha
and this color.txt:
0. 255 255 255 0
50. 255 0 0 50
100. 0 255 0 100
150. 0 0 255 150
with elevation in meters, and RGBA values between 0 and 255.
-
what option from the gdal_calc utility will transform the data range of my source file? The source file I am using was processed using gdal_calc. I also tried to open the source file from qgis, and it has a -2.6 min and max values. I was unable to change the color then. So I thought of changing the values of the min and max, from -1 to 1. And was able to get the desired output. How will I do that? – lovelyvm Feb 02 '15 at 09:16
-
How would you like values of -0.75, -0.25, 0.25 or 0.75 be represented? In your question it looks like you want 7 colours and nothing else. A colour ramp is also possible. – AndreJ Feb 02 '15 at 10:55
-
I just want to change its color based on their data values. And would want to do that in batch process. One of the color ramp available in qgis is the
RdYlBu. That is what I preferred to use. – lovelyvm Feb 03 '15 at 05:43 -
-
If I'm going to add this data value and color
< -3000 black> 3.402 whiteto the col.txt, will this be possible/acceptable? – lovelyvm Feb 03 '15 at 07:23 -
aquashould be equivalent tolight blue. I would not use < and >, but set a minimal and maximal value. – AndreJ Feb 03 '15 at 07:27 -
What do you mean by
set a min and max value? Do you mean if I set -1 as the min value anything below -1(-2, -1000, -3000, -32767 etc.) will be colored depending on what I have specified for that data value? And the same with the positive values? Correct me if I'm wrong. – lovelyvm Feb 03 '15 at 07:44 -
Just try it out, it costs nothing ... From my example you see that everything greater than 500 will get the same colour as defined for 500. – AndreJ Feb 03 '15 at 07:56
-
Can I assign negative values and values with decimal places in col.txt? – lovelyvm Feb 04 '15 at 03:42
-
1If the data type allows it, yes. See http://www.gdal.org/frmt_gtiff.html for allowed values. You might have to use gdal_translate if your dataset has only byte or integer type. – AndreJ Feb 04 '15 at 04:55
-
One of the types of color brewer palettes is diverging. And rdylbu is under that type. Can I color my raster image with that type? – lovelyvm Feb 04 '15 at 06:07
-
-
I tried to use the rdylbu color palette by just replacing the color name with the rgb equivalent in gdaldem and it was successful. Followed the link you gave me. Thank you! – lovelyvm Feb 04 '15 at 07:05
-
Hi @AndreJ. Just an addition to this topic(maybe you know the answer), I want to make my output/nodata value of my output transparent but since I'm planning to overlay the output I still want the colors assigned to the image visible. Will it be possible in gdaldem? How will I do it? – lovelyvm May 18 '15 at 08:02
-
From the help page http://www.gdal.org/gdaldem.html#gdaldem_hillshade, the option
-alphashould add a transparency band, but I have not tested it myself. – AndreJ May 18 '15 at 08:11 -
What should be the values of the -alpha?I am using color-relief option for this. – lovelyvm May 18 '15 at 09:22
-
From the same page: full opacity 255 (and no opacity for 0 value). I guess you can not mix opacity with colour names, so RGBA with four values between 0 and 255 should be best. – AndreJ May 18 '15 at 11:00
-
This is my gdaldem script
gdaldem color-relief -of GTiff input.tif -alpha color.txt output.tif. This is my color.txt255 255 255 0, 255 0 0 0, 0 255 0 0, 0 0 255 0but nothing happens. No transparency were applied to the image. – lovelyvm May 19 '15 at 07:16 -
-
Where can I find the elevation value of the raster? The value that corresponds to the assigned color, is that the elevation value? I forgot to include the assigned value for every color. Sorry. This is the content,
-1 255 255 255 0, -0.5 255 0 0 0, 0 0 255 0 0, 0.5 0 0 255 0,1 0 0 0 0– lovelyvm May 20 '15 at 06:24 -
Yes, it is the first value. If you set all transparency to zero, you won't see anything. – AndreJ May 20 '15 at 06:32
-
But in my case, only the nv is my problem;
nv 255 255 255 0. The output still appeared white. It didn't became transparent :( – lovelyvm May 25 '15 at 06:42 -
1
-
gdaldem color-reliefseems to create multiband rather than a singleband – Abel Melquiades Callejo Oct 19 '20 at 13:02
5
Here is a auto color script based on AndreJ's code:
================================================================================
Usage:
-------------
Custom color:
python gdaldem.py input_tif.tif color.txt output_color.tif
Auto color:
python gdaldem.py input_tif.tif auto output_color.tif

"""
import subprocess
import sys
import os
import tempfile
import numpy as np


def main(input_file, color_file, output_file):
    cmd = "gdaldem color-relief " + input_file \
          + ' ' + color_file + ' ' + output_file
    subprocess.check_call(cmd, shell=True)


def gen_color_file(input_file):
    fp, temp_file = tempfile.mkstemp(suffix='.txt')

    dem = DEM(input_file)
    dem.open()
    phase_data = dem.height_band.ReadAsArray()

    max_ph = np.nanmax(phase_data)
    min_ph = np.nanmin(phase_data)
    range_ph = max_ph-min_ph
    colors = ['black', 'blue', 'yellow', 'orange', 'red', 'white']
    with open(temp_file, 'w') as f:
        for i, c in enumerate(colors[:-1]):
            f.write(str(int(min_ph + (i + 1)*range_ph/len(colors))) +
                    ' ' + c + '\n')
        f.write(str(int(max_ph - range_ph/len(colors))) +
                ' ' + colors[-1] + '\n')
    os.close(fp)
    return temp_file


if __name__ == '__main__':
    input_file = sys.argv[1]
    color_file = sys.argv[2]
    output_file = sys.argv[3]
    if color_file == 'auto':
        print '\nauto generating color file'
        color_file = gen_color_file(input_file)
    with open(color_file, 'r') as f:
        print '\ncolor file contents'
        print '='*50
        for l in f.readlines():
            print l
    print '='*50
    main(input_file, color_file, output_file)
Sudipta Basak
- 171
- 1
- 5