4

I have a mock-up exam that my teacher gave me and one of the questions was the following:

Given these four graphs, which one represents regressive tax?

I'm quite sure it's graph A, but I don't seem to be able to find a proper reason why. Any help and/or tips are welcome!

Thanks in advance

EDIT: As per request. How I interpret this: regressive means the higher the income, the lower the tax. Thus: tax drops with higher incomes. But I can't really determine to which graph this applies.

enter image description here

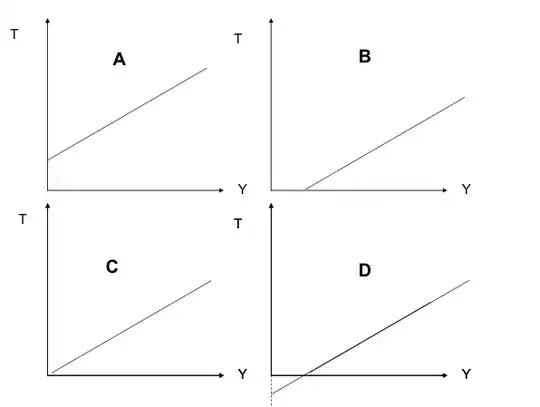
(T is tax, Y is income)

1 Answers1

4

You're correct it is graph A. Regressive tax means that the lower income you have the higher %tax you have. If you imagine at the lowest level of income, you still have a flat tax(The intercept).

Since the slope is constant the %tax component is the same for all income levels.

Therefore this flat tax component is the part you need to look at. The flat tax represents a larger proportion for lower income earners. As a whole (%tax + Flat tax) the tax is then a higher % for lower income earners, hence regressive taxation.

Lee Sin
  • 661
  • 3
  • 13