For displaying atmospheric soundings the use of Skew-T Log-P diagrams is very common. The manual THE USE OF SKEW T, LOG P DIAGRAM IN ANALYSIS AND FORECASTING from the Air Weather Service explains what this diagram is and how it can be used. What tools are available to create Skew-T Log-P diagrams and how do they differ?
Asked
Active
Viewed 7,423 times
11
-
1This question seems like it might be more suited to stats.SE, or perhaps even stackoverflow. Is there any reason it's specific to earth science? Also, it's kind of a recommendation question, which is generally discouraged. Might also be worth mentioning what you've already tried. – naught101 Oct 21 '14 at 04:58
-
2This question has nothing to do with statistics, it would not fit on stats.SE. To plot such a diagram one needs equations from meteorology. Therefore it is about earth science and should not go to the stackoverflow programming Q+A. – BHF Oct 21 '14 at 05:07
-
The real site to put this question on is [softwarerecs.se] ;-) – Jan Doggen May 29 '15 at 10:11
2 Answers
16
Skew-T Log-P diagrams can be plotted in most mathmatics software. I have seen examples in Matlab (and by proxy Octave), GrADS, NCL, IDL and I have my own code in Python that generates Skew-T plots. There are also some programs such as NSHARP and BUFKIT that are more full featured. You can also find websites that plot forecast soundings such as twisterdata and real data soundings.
The major variances arise from the specific use case of whoever wrote the code you are using. The most basic code will generally be able to tell you the lifting condensation level (LCL), level of free convection (LFC), equilibrium level (EL) and perhaps the 500 mb lifted index, all for a surface parcel.
The more advanced code will generally be able to calculate the above quantities not just for surface parcels, but also for the mixed layer and be able to find the most unstable parcel. Convection oriented code will give you CAPE, storm tops and other severe weather parameters and will also tend to be able to analyze the hodograph. BUFKIT can do analysis to identify snow growth levels and some other winter weather related quantities.
One of the subtle differences in skew-T plotting software is how they handle the moist adiabats. This can be modeled as a fully reversible process or a pseudo reversible process and this produces subtle temperature differences aloft on the adiabat. There can also be differences in whether the moist adiabat only considers liquid water and vapor, or if ice process are included in the latent heat release.
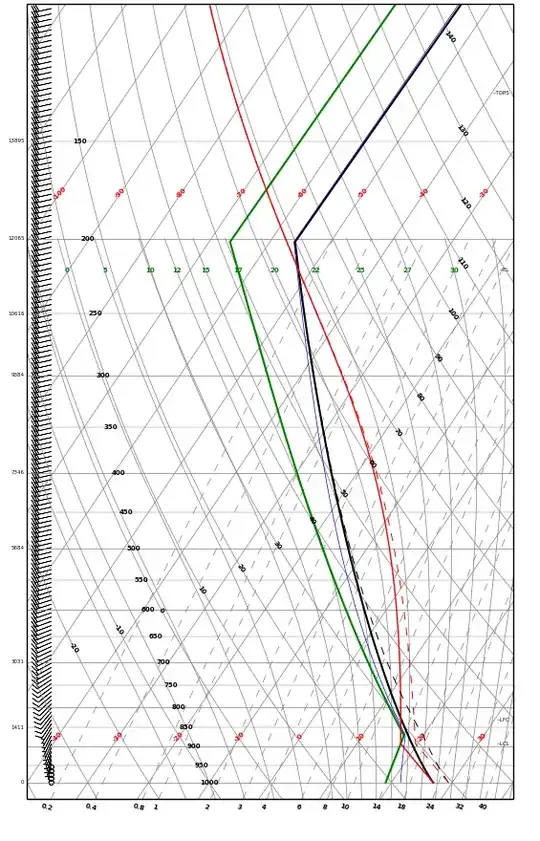
Here is an example of what my Python code produces:
Var          SFC            ML              MU
CAPE  J/kg   1877           1877            2415
CIN   J/kg   46.9           46.9            0.4
LI_max       -9.5           -9.5            -11.3
LI_500       -7.3           -7.3            -8.4
LI_30        -4.8           -4.8            -6.4
TOPS  m      14800          14800           15400
LCL   mb (m) 892 (1000)     892 (1000)      862 (1292)
LFC   mb (m) 831 (1604)     831 (1604)      857 (1343)
PRS   mb     1000           1000            871
casey
- 14,146
- 4
- 58
- 82
-
+1 Great answer. If you are willing to share your code, it would be great if you can post a link to it. – milancurcic Apr 24 '14 at 19:15
-
1The code is available at https://github.com/cwebster2/pyMeteo or via
pip install pymeteo. Should work in both python 2 and 3, but I only test in 3. – casey Jul 07 '15 at 00:17
1
Assuming you want to plot a diagram with your computer, the RAOB Program is the most versatile Skew-T plotting program available. It's easy to use and fully menu driven.
John Shewchuk
- 11
- 2
-
Are you affiliated with this product? http://earthscience.stackexchange.com/help/promotion – Deditos Aug 14 '15 at 12:19