UPDATED TO INCLUDE OP'S DATA AND DEMONSTRATING LOOSE AND TIGHT TRACKING
A simple way to do this is a leaky peak hold optionally followed by a low pass filter to further smooth the waveform it desired. Also see this answer which can also be applied here where an alternate peak detector was used with a Gaussian filter for a symmetrical response around the detected peaks.
The leaky peak hold is implemented by this simple conditional equation:
if $y[n]> |x[n]|$ then $y[n]=|x[n]|$, else $y[n] = \alpha y[n-1]$
The parameter $\alpha$ is the leak rate and is always <1. The closer $\alpha$ is to one, the slower the decay.
The block diagram is shown in the graphic below.

An example result is plotted below without the final low pass filter (LPF) with $\alpha =0.92$ (a lower $\alpha$ value results in faster decay and tighter tracking to short term changes):

This is subsequently smoothed by the use of a low pass filter, which can be implemented as a simple moving average or cascade of moving averages for more smoothing. The above result after subsequent filtering is shown in the plot below:

The beauty is in its simplicity and ease of adjusting the tracking as demonstrated by the python code I used for the above example:
alpha=0.92
out = [0]
for sample in wfm:
    out.append(max(np.abs(sample), alpha*out[-1]))
coeff = sig.firls(15, [0, .4, .6, 1], [1,1,0,0])
out2 = 1.06*sig.filtfilt(coeff,1,out)
plt.plot(wfm)
plt.plot(out2)
Below is the same process with "looser tracking" using $\alpha =0.995$:


Further explanation of operation is as follows:
First take the absolute value of the signal (looks like the OP has already done this).
Then test if the absolute value is greater than the output of the leaky peak hold. If so reset the output of the leaky peak hold to be this value, otherwise the output is the previous output multiplied by the leak parameter $\alpha$.
An optional low pass filter will then smooth the edges. The cutoff determines the tracking rate of the peak; the lower the cutoff the slower the allowed rate of change of the peak. A gain adjustment compensates for the averaging operation of the filter; the tighter the filter the longer the effective averaging window will be and therefore a greater gain is required. The value for the leak rate and cutoff of the filter can be determined empirically.
In my code, I used filtfilt as implementation of the low pass filter operation. This is non-causal zero-phase filter appropriate for post-processing as done here. As a zero-phase filter, the output is aligned with the input so I used it for that convenience. In actual implementation, a traditional FIR low pass filter or even a simple moving average could be used with the output inevitably delayed from the input.
Why Hilbert Won't Work
To clear up a possible misunderstanding by the OP, the reason a Hilbert approach won't work is NOT because the signal is aperiodic. It is because the Hilbert will provide an envelope of a signal at a given passband carrier frequency (with a carrier higher than the occupied signal bandwidth) which is not the case here. This is just mixing terminology in what we mean by "envelope". When we use the Hilbert to determine the envelope, we are specifically referring to the envelope as being the baseband amplitude modulation signal of a sinusoidal carrier frequency, where that frequency is higher than the highest frequency component of the baseband signal. In the OP's case, it is the baseband signal that is provided, so the result is already the "envelope" in that context.
Let me explain this by using the OP's example:
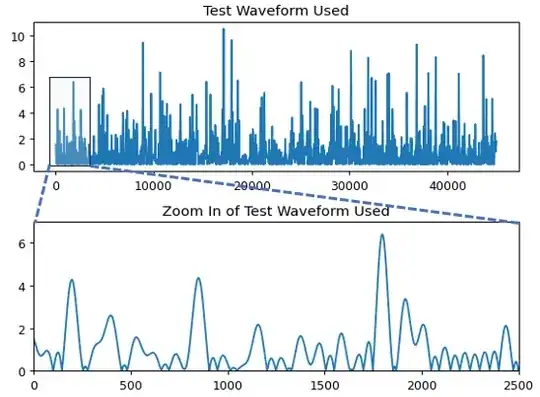
Below is the same test signal I used for the example above, with a view zoomed in on the first 2500 samples. What the OP wants is an output waveform that transitions the major peaks shown, while what is shown is the input waveform I used without any modification.
If this signal was the amplitude modulation for a higher frequency carrier, that modulated signal would appear as follows, with the result of using the absolute value of the Analytic Signal (Hilbert envelope approach) to extract the "envelope" in that context (here zoomed in on the first 600 samples of the waveform above:

Here we see the actual sinusoidal carrier with amplitude modulation (AM), with the "envelope" being the modulated amplitude waveform specifically. This is the typical use case and application for using the Hilbert Transform to extract the envelope. Other posts here may suggest that the signal needs to be narrow band and that is not the case; we only need to know the carrier frequency and that the carrier frequency is above the bandwidth of the baseband signal for this to work properly.
Bottom line, this is clearly a different envelope than what the OP is referring to, and why a leaky peak hold would be an easy solution to get what the OP really wants.
 Red line is the function I'd like to obtain somehow. Everything <= -60 is basically absent data (i.e. not low signal).


matornpzfile? – Royi Jun 30 '23 at 06:03