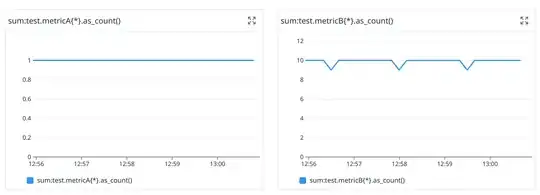
I'm considering setting up an open telemetry pipeline that will use open telemetry collector to route metric data to different backends. I'm looking at allowing datadog instrumentation in code to send metric data to open telemetry deployment with statd receiver and datadog & file exportes. This is my test config:
receivers:
  statsd/2:
    endpoint: "localhost:9125"
    aggregation_interval: 10s
exporters:
  datadog:
    api:
      site: datadoghq.com
      key: ${env:DD_API_KEY}
  file/no_rotation:
    path: /tmp/otel_exporter
service:
  pipelines:
    metrics:
      receivers: [statsd/2]
      processors: []
      exporters: [datadog,file/no_rotation]
For testing purposes, I'm running datadog agent and otel statsd collector in parallel (on different ports) and sending data to them in parallel as well, like this:
watch -n 1 'echo "test.metricA:1|c" | nc -w 1 -u -c localhost 9125'
watch -n 1 'echo "test.metricB:1|c" | nc -w 1 -u -c localhost 8125'
So both are getting a ping every second, a value of 1. Considering my aggregation block being 10 seconds, I should be getting a count of about 10 on each block.
However, for some reason the statsd receiver does not seem to want to aggregate these properly, and when I look into my file exporter, I see multiple values being stored with same timestamp, and a count of 1.
{
"resourceMetrics": [
{
"resource": {},
"scopeMetrics": [
{
"scope": {
"name": "otelcol/statsdreceiver",
"version": "0.85.0"
},
"metrics": [
{
"name": "test.metricA",
"sum": {
"dataPoints": [
{
"startTimeUnixNano": "1696956608876128922",
"timeUnixNano": "1696956618875880086",
"asInt": "1"
}
],
"aggregationTemporality": 1
}
}
]
}
]
}
]
}
{
"resourceMetrics": [
{
"resource": {},
"scopeMetrics": [
{
"scope": {
"name": "otelcol/statsdreceiver",
"version": "0.85.0"
},
"metrics": [
{
"name": "test.metricA",
"sum": {
"dataPoints": [
{
"startTimeUnixNano": "1696956608876128922",
"timeUnixNano": "1696956618875880086",
"asInt": "1"
}
],
"aggregationTemporality": 1
}
}
]
}
]
}
]
}
This is seems to be sent in this form to datadog and results in invalid counts:
I do not know exactly what is happending but datadog only prints a single value from a 10 value block of time. I presume some sort of deduping in datadog drops the other values, or maybe just a single value is being sent? Either way, since we have an aggregation block of 10sec, I should see all these 10 metrics be combined into one, and sent to datadog or file exporters, like this:
{
  "resourceMetrics": [
    {
      "resource": {},
      "scopeMetrics": [
        {
          "scope": {
            "name": "otelcol/statsdreceiver",
            "version": "0.85.0"
          },
          "metrics": [
            {
              "name": "test.metricA",
              "sum": {
                "dataPoints": [
                  {
                    "startTimeUnixNano": "1696956608876128922",
                    "timeUnixNano": "1696956618875880086",
                    "asInt": "10"
                  }
                ],
                "aggregationTemporality": 1
              }
            }
          ]
        }
      ]
    }
  ]
}
What am I doing wrong, why is not this working ? It seems to me that it's impossible that statsd receiver is this broken in otel.
