Wolfram recently released a free Wolfram Engine that can be called in Python (and other languages) so you can use its functions like TimelinePlot.
First get some dateIntervals by using the start and end dates of 2017 "TropicalStorm" hurricanes.
ec = EntityClass["TropicalStorm", "Hurricanes2017"];
timeIntervals = Interval /@ EntityValue[ec, {"StartDate", "EndDate"}];
timeIntervals contains Intervals of DateObjects. The first 3 of these are
timeIntervals[[;; 3]]

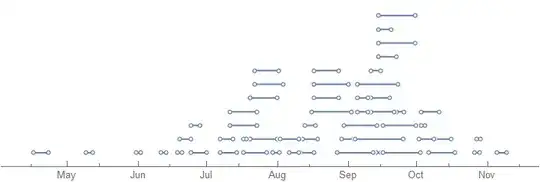
A basic TimelinePlot of timeIntervals gives
TimelinePlot[timeIntervals]
However, TimelinePlot has many options to customise it. For example, take timeIntervals, GatherBy "Month", SortBy the first date of first interval in each set (see Part), and add an Automatic LineLegend using the "MonthShortName"s of each set as legend keys.
With[{
  byMonth =
   SortBy[#[[1, 1, 1]] &]@GatherBy[timeIntervals, DateValue[#[[1, 1]], "Month"] &]
  },
 TimelinePlot[
  byMonth,
  PlotLegends ->
   LineLegend[Automatic, DateValue[#[[1, 1, 1]], "MonthNameShort"] & /@ byMonth]
  ]]

Hope this helps.
TimelinePlotfunction just returns a Graphics object. Very cool vis though. – Jeff May 09 '20 at 04:11Graphicsobject in a Raster Image Formats or Vector Graphics Formats;wolfSession.evaluate( wl.Export( '<path with image filename>', graphics_object ) )– Edmund May 09 '20 at 11:49