Note that in the article published that figure is different from the preprint!
See the figure:
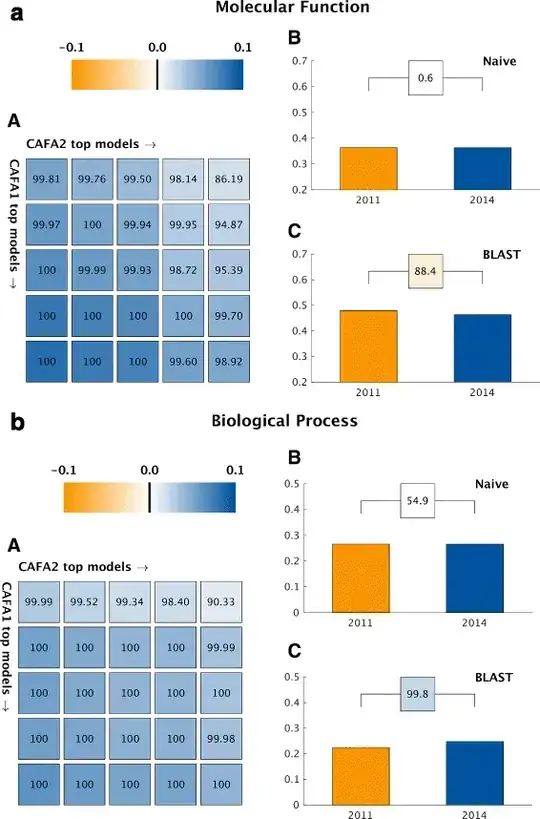
As they aren't substantially different in display other than showing the two set of predictions that are comparable between CAFA1 and CAFA2 I explain them below:
The colors are the margins of $F_{max}$ they refer to the equation found in the section "Comparison between CAFA1 and CAFA2 methods" under methods:
$$\delta(m_2, m_1) = \frac{1}{B}\sum_{b=1}^{B}F_{max}^{b}(m_2)-\frac{1}{B}\sum_{b=1}^{B}F_{max}^{b}(m_1)$$
Where B is the 10000 bootstraps they did and $m_1$ and $m_2$ are the CAFA1 and CAFA2 methods.
Where $F_{max}$ is explained in the article (and in the preprint) as:
A perfect predictor would be characterized with $F_{max} = 1 $
So, the higher the (positive) difference is, the better precision and recall (See wikipedia) are for those methods. Note that the scale is from -0.1 to 0.1 not from -1 to 1 so the differences are quite small (One could argue that the log10 would be better to see those small differences)
One can appreciate that in the bar plots at the right, where the differences between each dataset are small in the B section, so the color is white, and in the C panels they have brighter color.
The numbers in the boxes are the percentage that a CAFA2 method did better than a method in CAFA1 for another dataset in the "intersection of the two GO snapshots" as noted in the methods section. (But it is also not clear to me)

