How a sunspot number is calculated by an individual observer?
I would like to learn how to calculate the daily number of sunspots and where to get daily input images of the Sun.
I have read tens of web links and none mentioned or described any algorithm to work for the calculation of the sunspot number.
https://analyzer.depaul.edu/paperplate/Tracking%20Sunspots.htm
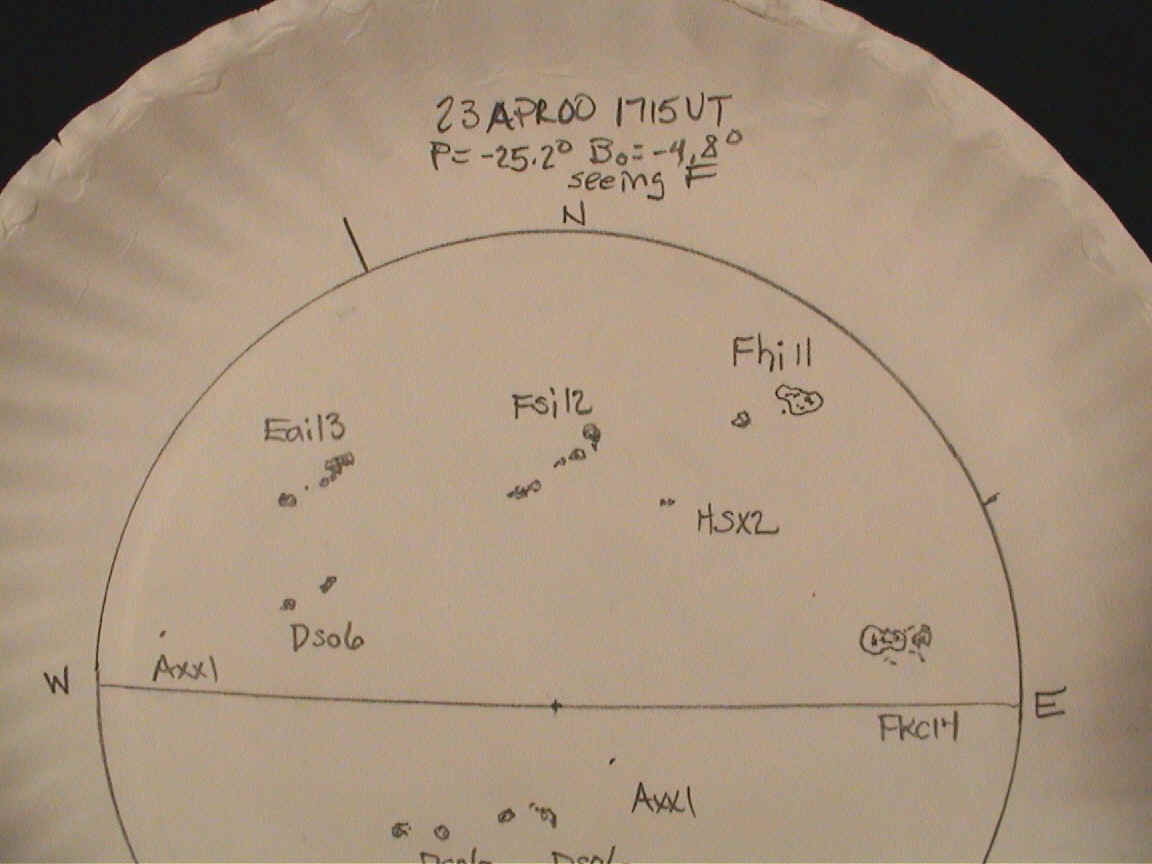
What is the number of sunspots in this paper plate drawing?
https://analyzer.depaul.edu/paperplate/images/Sun_trace_Clyde_zoomR.jpg
visited NOAA, NASA, ESA, SILSO
https://www.sidc.be/silso/dayssnplot
and still no hint and how numbering, encoding is assigned to individual sunspots in the paper plate drawing (as above).
thank you exactly what I mean
watch this still image taken from the video and tell me why the number of sunspots jumps from 6 to 16 for the same blurred image
Ok, I can detect 7 sunspots but how could I count 16 sunspots ?
– darius Nov 02 '22 at 13:15https://analyzer.depaul.edu/paperplate/images/Sun_trace_Clyde_zoomR.jpg
__ I watched carefully the encoding assigned and attached to individual groups of sunspots and discovered the encoding system: Eai13 stays for 13 sunspots, Fhi11 stays for 11 sunspots, Axx1 stays for 1 sunspot, ... . So counting quickly the numbers of sunspots above the W-E line I get 56 sunspots vs. your count of 35. Since image is blurred for small sunspots the only reliable to me sunspots count is encoded as Axx1.
– darius Nov 02 '22 at 13:50unfortunately, never completed
https://www.codeproject.com/Articles/812896/Sunspot-Surface-Calculation-Case-Study-on-solving?msg=5907254#xx5907254xx
– darius Nov 02 '22 at 23:35visit of the coordinators from Japan and count the number of sunspots from the solar image attached below the charts vs. 75 counted by them https://swc.nict.go.jp/en/trend/sunspot.html
– darius Nov 03 '22 at 11:11but his mail server is down Address not found Your message wasn't delivered to bueter@transitofvenus.org because the address couldn't be found or is unable to receive email.
https://analyzer.depaul.edu/paperplate/images/Sun_trace_Clyde_zoomR.jpg from Linkedin Independent Informal Education Professional
Granger, Indiana, United States Contact info
https://analyzer.depaul.edu/paperplate/
– darius Nov 03 '22 at 13:38STARA Project: STARA
https://theses.gla.ac.uk/3429/1/2012watsonphd.pdf
Glasgow Theses Service http://theses.gla.ac.uk/ theses@gla.ac.uk Watson, Fraser Thomas (2012) Investigating sunspot and photospheric magnetic field properties using automated solar feature detection. PhD thesis. http://theses.gla.ac.uk/3429
Fraser Watson National Solar Observatory, Tucson, AZ 85719, USA
– darius Nov 03 '22 at 21:43V.
https://www.codeproject.com/Articles/812896/Sunspot-Surface-Calculation-Case-Study-on-solving?msg=5907254#xx5907254xx
abandoned project since V. left institute I need to contact Chuck Bueter from Paper Plate Backyard Astronomy Project analyzer.depaul.edu/paperplate since his sunspots count is for real
analyzer.depaul.edu/paperplate/images/Sun_trace_Clyde_zoomR.jpg
He moved from project to project and hope to contact him via Facebook one day. Than I go to Japan: swc.nict.go.jp/en/trend/sunspot.html
– darius Nov 03 '22 at 21:56from https://spaceweather.com/
2M labeled sunspots https://spaceweather.com/images2022/03nov22/hmi1898.gif
4M no labels sunspots https://spaceweather.com/images2022/03nov22/hmi4096_blank.jpg
Sunspot number: 65 4M is clear, sharp Sunspot number: 65
3135 label - 2 sunspots/ groups 3136 label - 2 sunspots/ groups
R = K (10g + s) = 65 ? what is a number of groups in the image ?
– darius Nov 04 '22 at 11:37"getting the total surface area that is dark and the number of different regions is really easy for today's image processing maths.
https://swc.nict.go.jp/data/latest/sdo/latest_512_HMIIF.mp4
Total surface area is not easy sunspots index if sunspots look like tiny pixels in the video above
So sunspots count still matters
– darius Nov 04 '22 at 19:13There is another guy interested in total surface of sunspots
Gimp supports supports back projection of 2D solar disc image onto sphere
https://groups.google.com/g/uk.sci.astronomy/c/7IbJzwTF2fQ
Hope to get script to count black pixels on the sphere
Tried Mosaic and more tools for morphological image analysis
But need to learn working definition of the group of sunpots as defined in astronomy
– darius Nov 05 '22 at 16:17sunspot/s in the image is/are called a groups of sunspots one day and individual sunspots another day
Since number of sunspots index is published officially every day all I need is to verift the published count against input image file at preset resolution.
What input image resolution is set for the official count of sunspots in Japan, US, Greenwich, Belgium?
I assume naked eye observations of solar disc are not done real time for sunspot count https://solarscience.msfc.nasa.gov/greenwch.shtml
– darius Nov 06 '22 at 15:47Is 11 inches diameter a standard in naked eye or camera observations ?
https://watermark.silverchair.com/mnras20-0013.pdf
4tt:r. Carrington, Singular Appe~rance in the Sun
Description of a Singular Appearance seen in tlte Sun on September 1, I 859· By R. C. Carrington, Esq
The image of the sun's disk was, as usual '\Vith me, projected on to a plate of glass coated with distemp~r of a pale straw colour, and at a distance and under a po\ver which presented a picture of about I I inches diameter
– darius Nov 07 '22 at 09:42The Sun as seen by Solar Orbiter in extreme ultraviolet light from a distance of roughly 75 million kilometres. The image is a mosaic of 25 individual images taken on 7 March by the high resolution telescope of the Extreme Ultraviolet Imager (EUI) instrument. In total, the final image contains more than 83 million pixels in a 9148 x 9112 pixel grid, making it the highest resolution image of the Sun’s full disc and outer atmosphere, the corona, ever taken.
ESA & NASA/Solar Orbiter/EUI team; Data processing: E. Kraaikamp (ROB)
– darius Nov 09 '22 at 00:17https://www.esa.int/var/esa/storage/images/esa_multimedia/images/2022/03/the_sun_in_high_resolution/24010613-1-eng-GB/The_Sun_in_high_resolution.jpg
In total, the final image contains more than 83 million pixels in a 9148 x 9112 pixel grid, making it the highest resolution image of the Sun’s full disc and outer atmosphere, the corona, ever taken.
– darius Nov 09 '22 at 00:19Image 1 - 2M https://spaceweather.com/images2022/10nov22/hmi1898.gif
Image 2 - 4M https://spaceweather.com/images2022/10nov22/hmi4096_blank.jpg
Image 3 https://www.sidc.be/uset/data/cameras/output_img/png/L1c_png_2048_text/USET_White_Light/2022/11/UPH20221110131943.png
Image 4 https://swc.nict.go.jp/data/latest/sdo/latest_512_HMIIF.jpg?20220404
– darius Nov 10 '22 at 23:50https://www.sidc.be/uset/data/cameras/output_img/png/L1c_png_2048_text/USET_White_Light/2022/11/UPH20221110131943.png
As NASA Citizen Scientist I hope to get quality images of solar disc, acquired by @ NASA
– darius Nov 16 '22 at 18:40